Hi Wrike Community 👋
We are thrilled to introduce a new feature for Dashboards that enables you to see time spent in various statuses and status changes. This feature is designed to help you identify bottlenecks and enhance process efficiency 🚀
Feature Highlights:
Key Metrics:
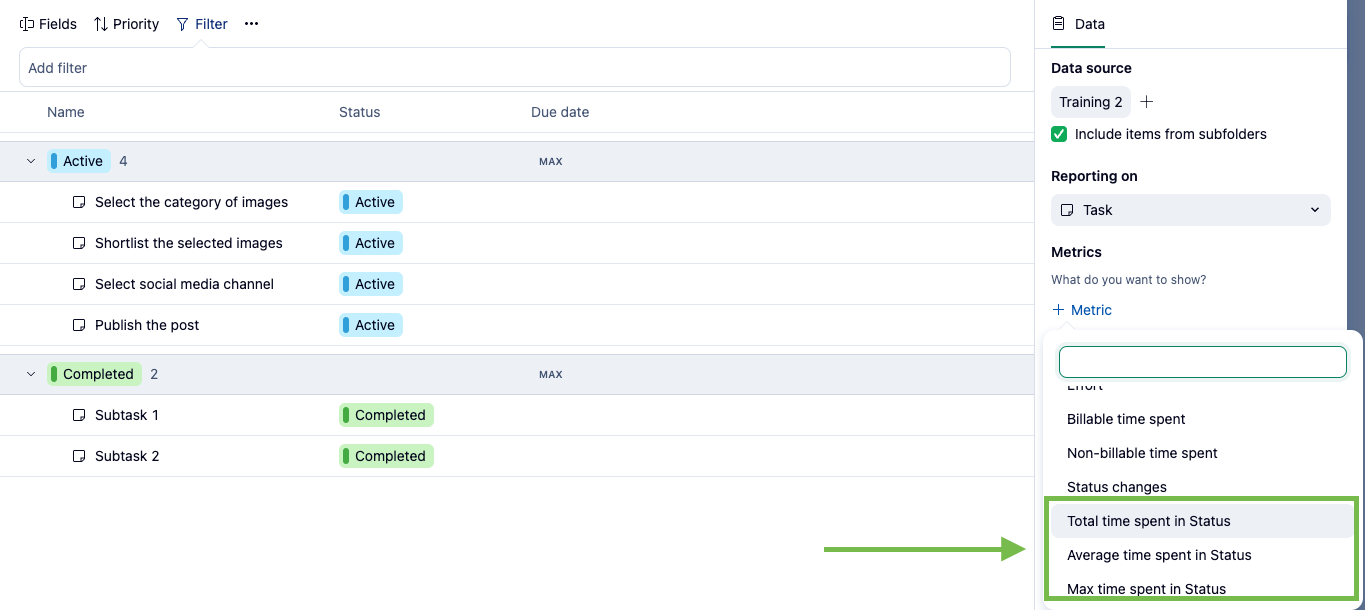
⏱️ Time Spent in Status: Includes total, average, and maximum time spent in a status.
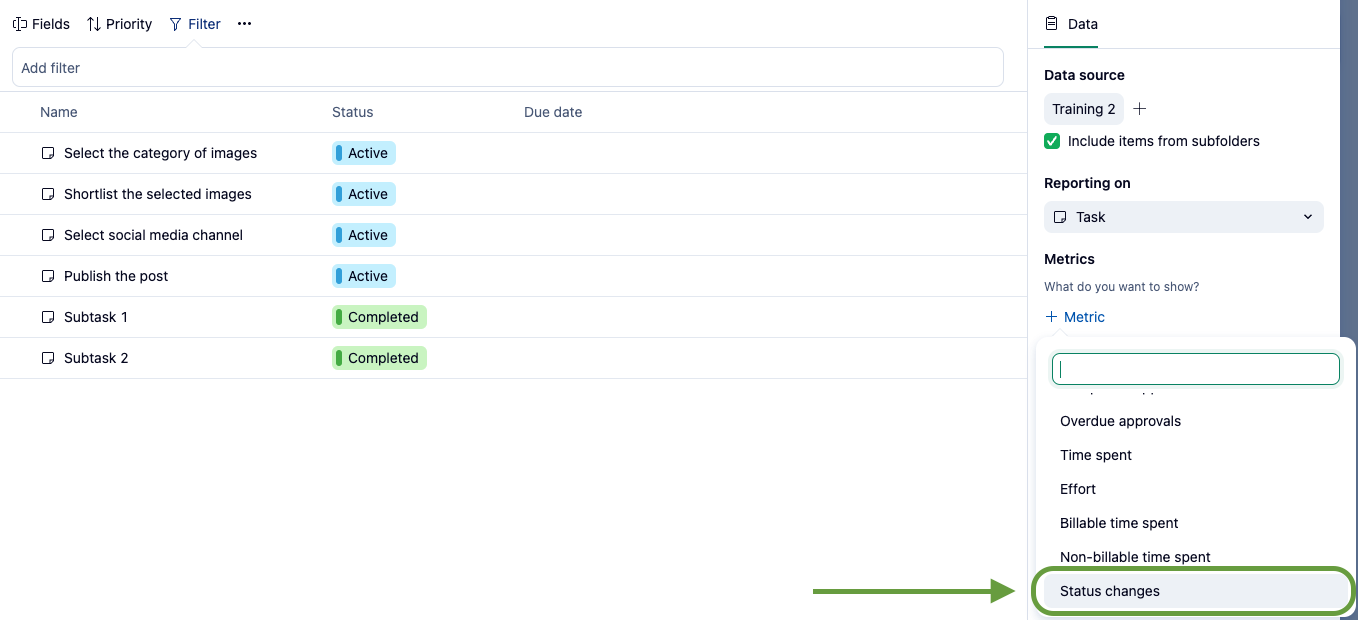
- 🔄 Status Changes: Tracks the number of times a status changes to pinpoint process inefficiencies.
Use Cases:
- 📊 Ideal for process analysis, tracking progress, and identifying failures or bottlenecks.
- ✔ ️ Applicable to tasks, projects, or custom item types (CIT’s).
New Dimensions:
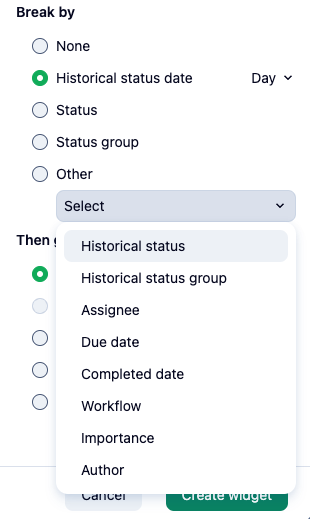
- 🕒 Historical Status: Records when an item was in a particular status historically.
- 📅 Historical Status Groups and Dates: Offers added context for thorough analysis.
Templates:
- Interrupted Workflows: Monitors frequency of process interruptions.
- Average Status Times: Analyzes the duration spent in different statuses.
- Total Time Active: Focuses on development time, recognizing current limitations in cycle time tracking.
Note: This feature currently supports reporting on calendar days but not business days.
For more information, please refer to our Help Center Article.
We are excited to see how this new feature will aid in refining your processes and driving efficiency. Feel free to give it a try and share your feedback! 🗨️