I am trying to use Wrike analysis to creation a Visualization report for the mangement team to track internal team's performance on daily basis. By looking through all the time related dimensions, I didn't find any dimensions that can help me to achieve this daily performance report.
Please see the example showing below:
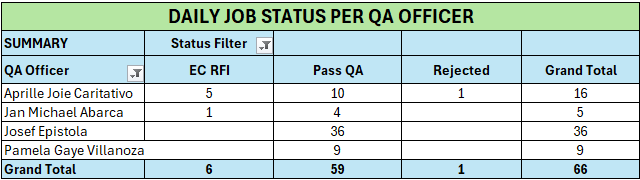
This table showing that how many projects under each status and under each QA officers's name based on the system date, like 20/01/2025 in Sydney.