It' be helpful to graph percent custom fields.
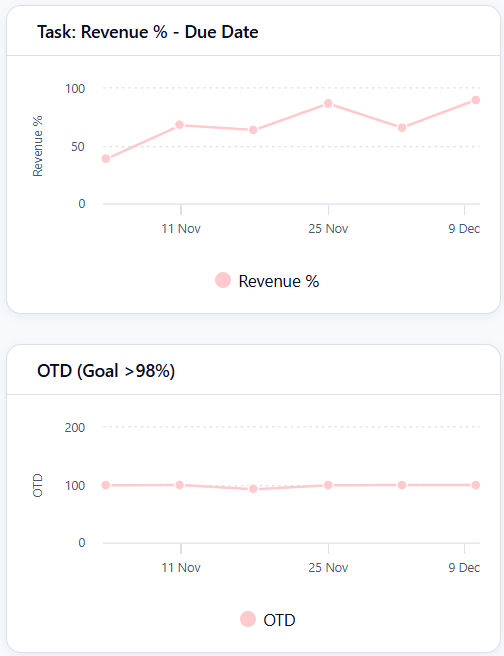
The workaround is to change the custom field to a number (not percent) and then have the team enter the value. While this works, it looks strange. These charts are graphed using numbers instead of percents.
If I change the custom field to a percent, Wrike doesn't allow graphing, and this is what the widget edit screen shows: