Hello Community!
We're excited to introduce the latest updates to the New Dashboards feature, one of the best tools for efficiently managing your work in Wrike! 🚀 Let’s dive into all the improvements we have for you!
- 📍 Major functionality improvements
- 📍 Create, edit, and adjust within one click
📍 Major functionality improvements 🤩
We're thrilled to announce the long-awaited addition of the 'Date breakdown' feature on New Dashboards. We’ve listened to your feedback on time segmentation in reports and Dashboards and we've developed and implemented the ability to segment a given time frame by day, week, month, or year in Chart-types widgets. This allows robust aggregation over your selected segmentation criteria. For example, you can now have a count of tasks in 2023 segmented by month, providing a clear view of your task progress in finer detail.
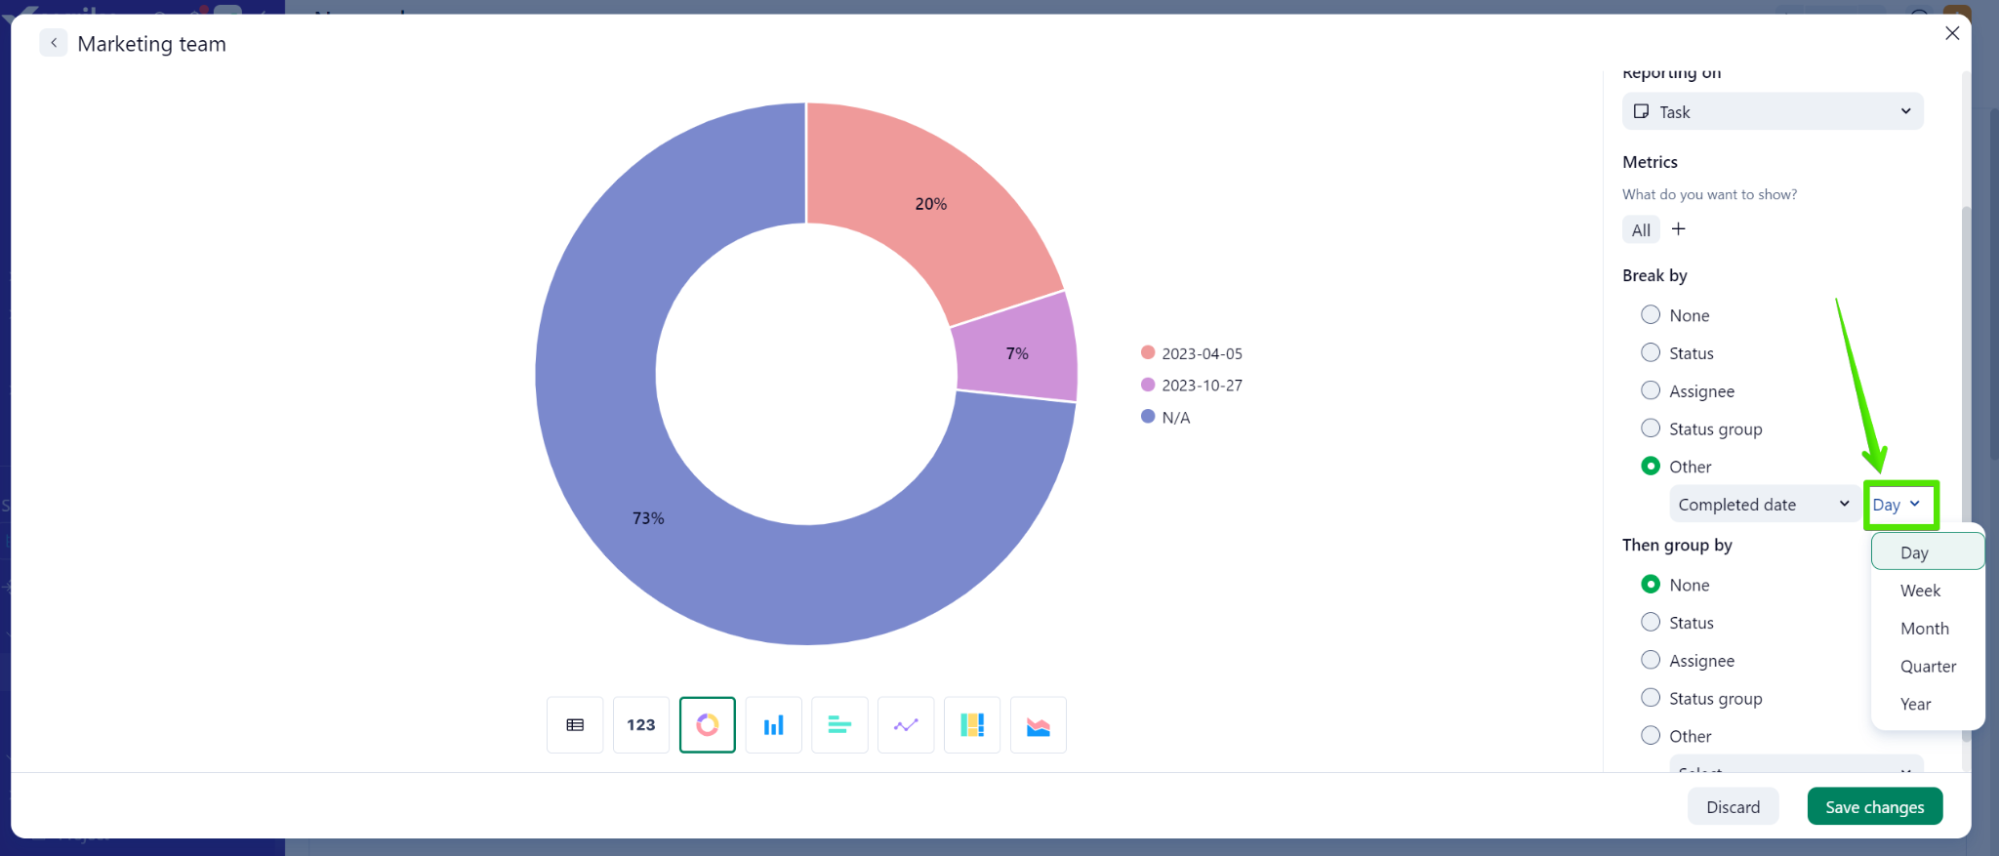
This functionality extends to date fields such as the due or completed date. This option is also available in Chart View, and we're working on improving this feature with new labels to make your reporting process even more seamless.
- Hierarchical and list view 📊
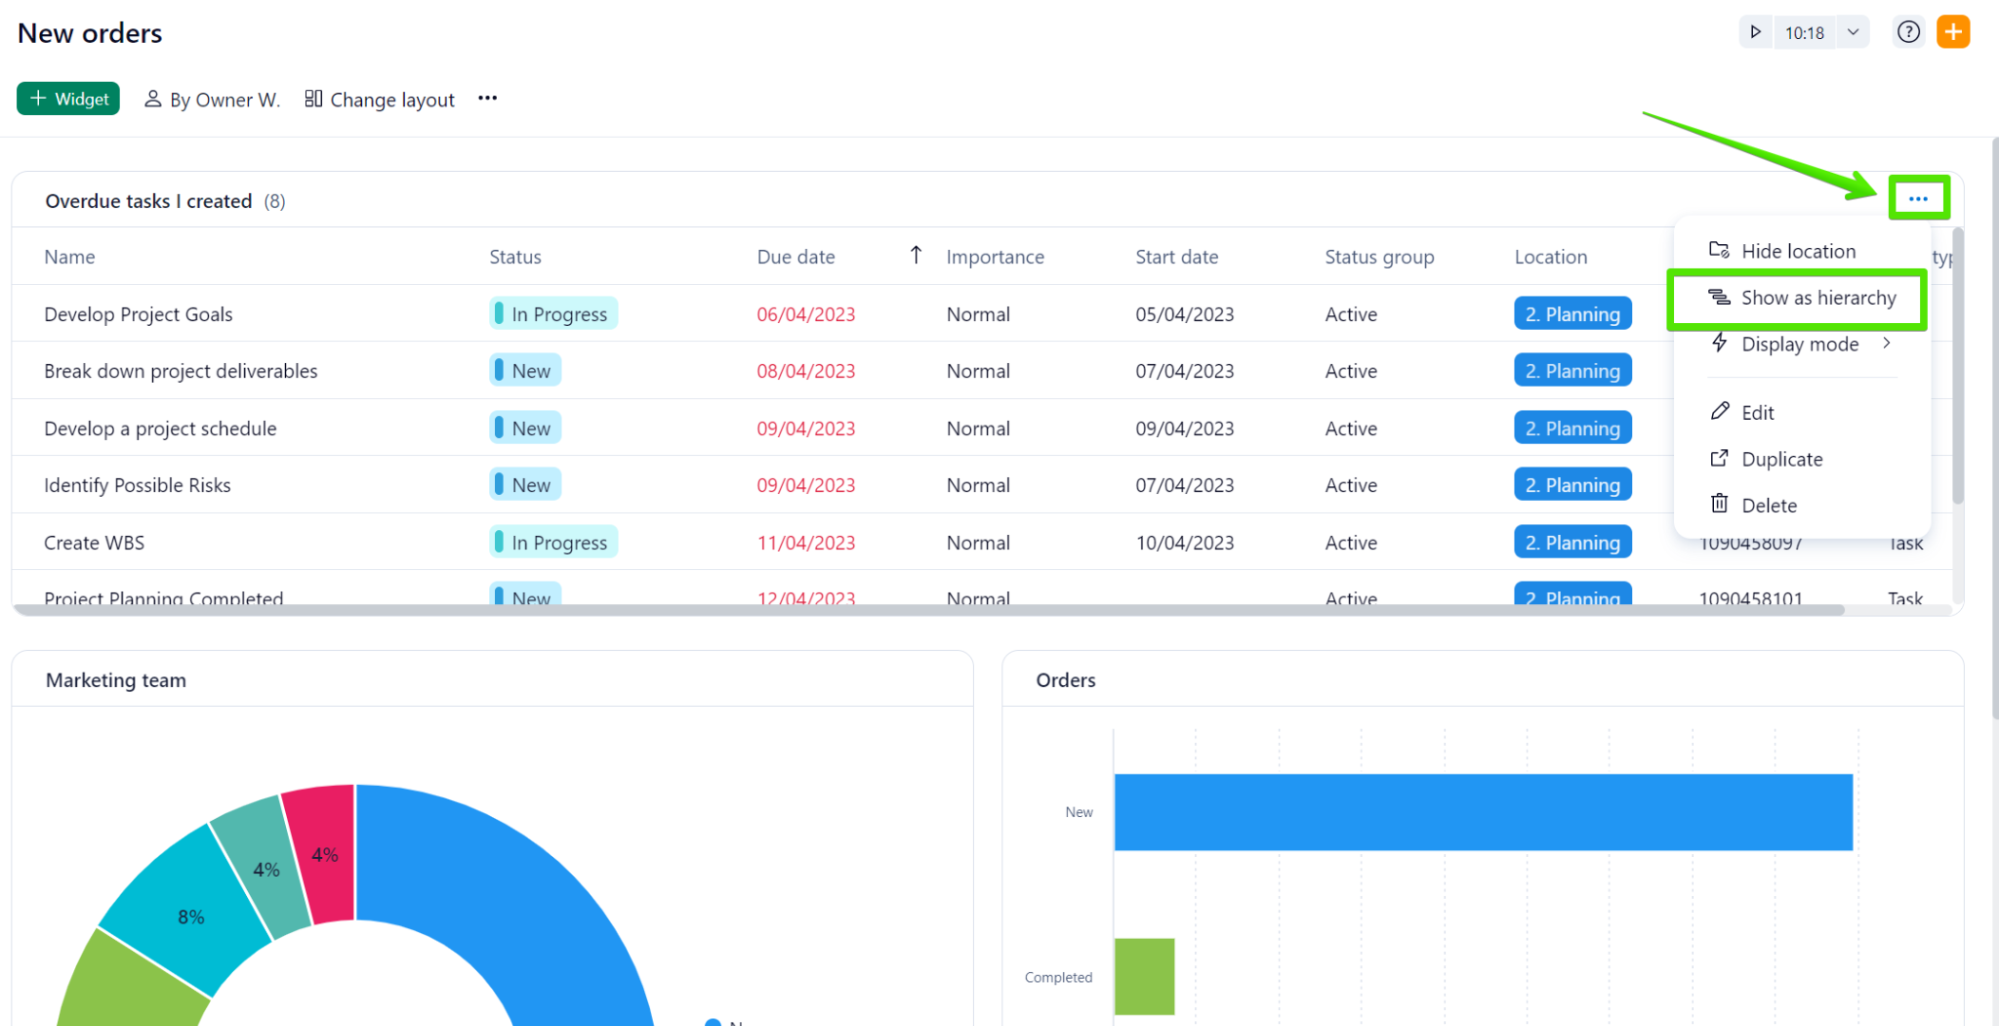
Your feedback has been essential to help us develop an option to ensure that no tasks or subtasks are overlooked in your Dashboards and now you can choose to display your items in a hierarchical view or a list view in List/Table-type widgets.
When using the hierarchical view, the subtasks will be nested under their parent task:
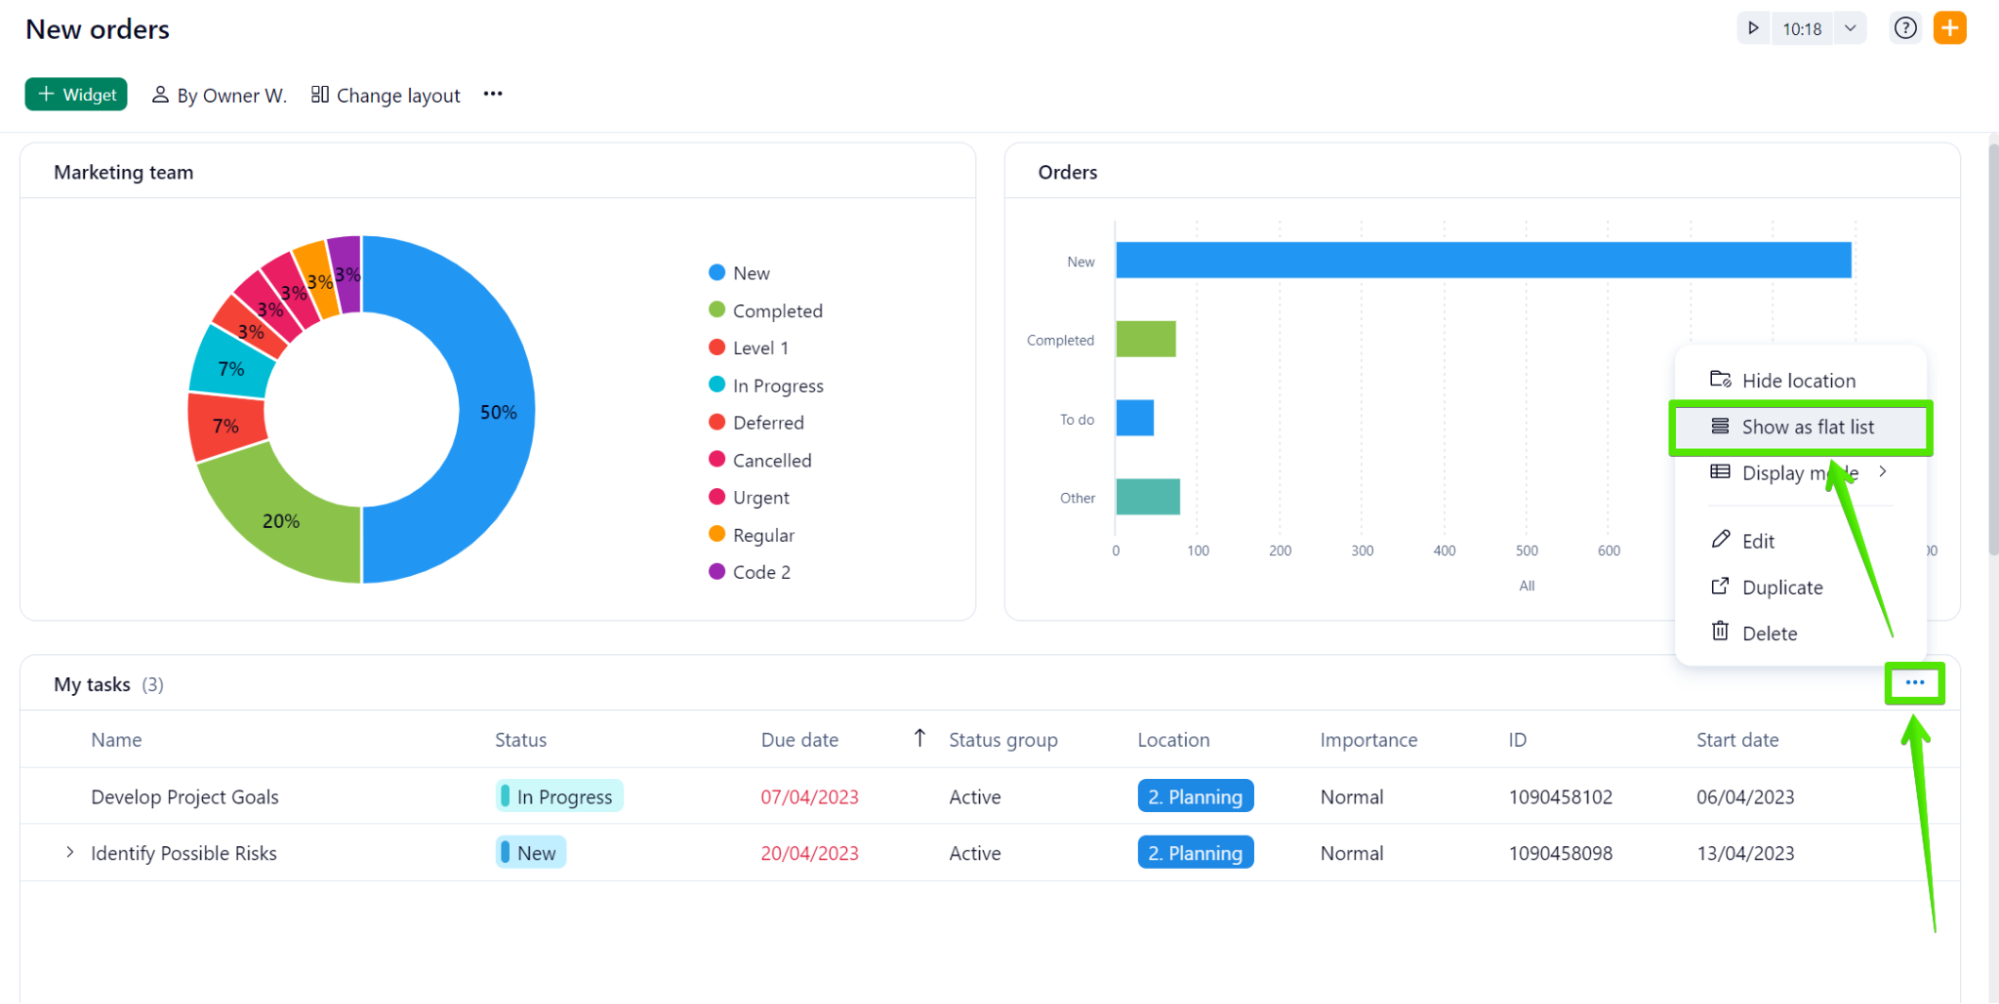
However, we learned from your feedback here on Community that this behavior may lead some users to overlook subtasks. If that is the case for your team, you can now use the ‘Show as flat list’ option, which allows you to see all the tasks (and subtasks) separate from each other.
- Table mode or List mode (or Auto mode!) ⚡
You can now choose how much information you need to display about your tasks when using List/Table-type widgets in New Dashboards. The table mode will allow you to choose how many columns you wish to make visible in your widgets and all the information will be displayed in a horizontal layout:
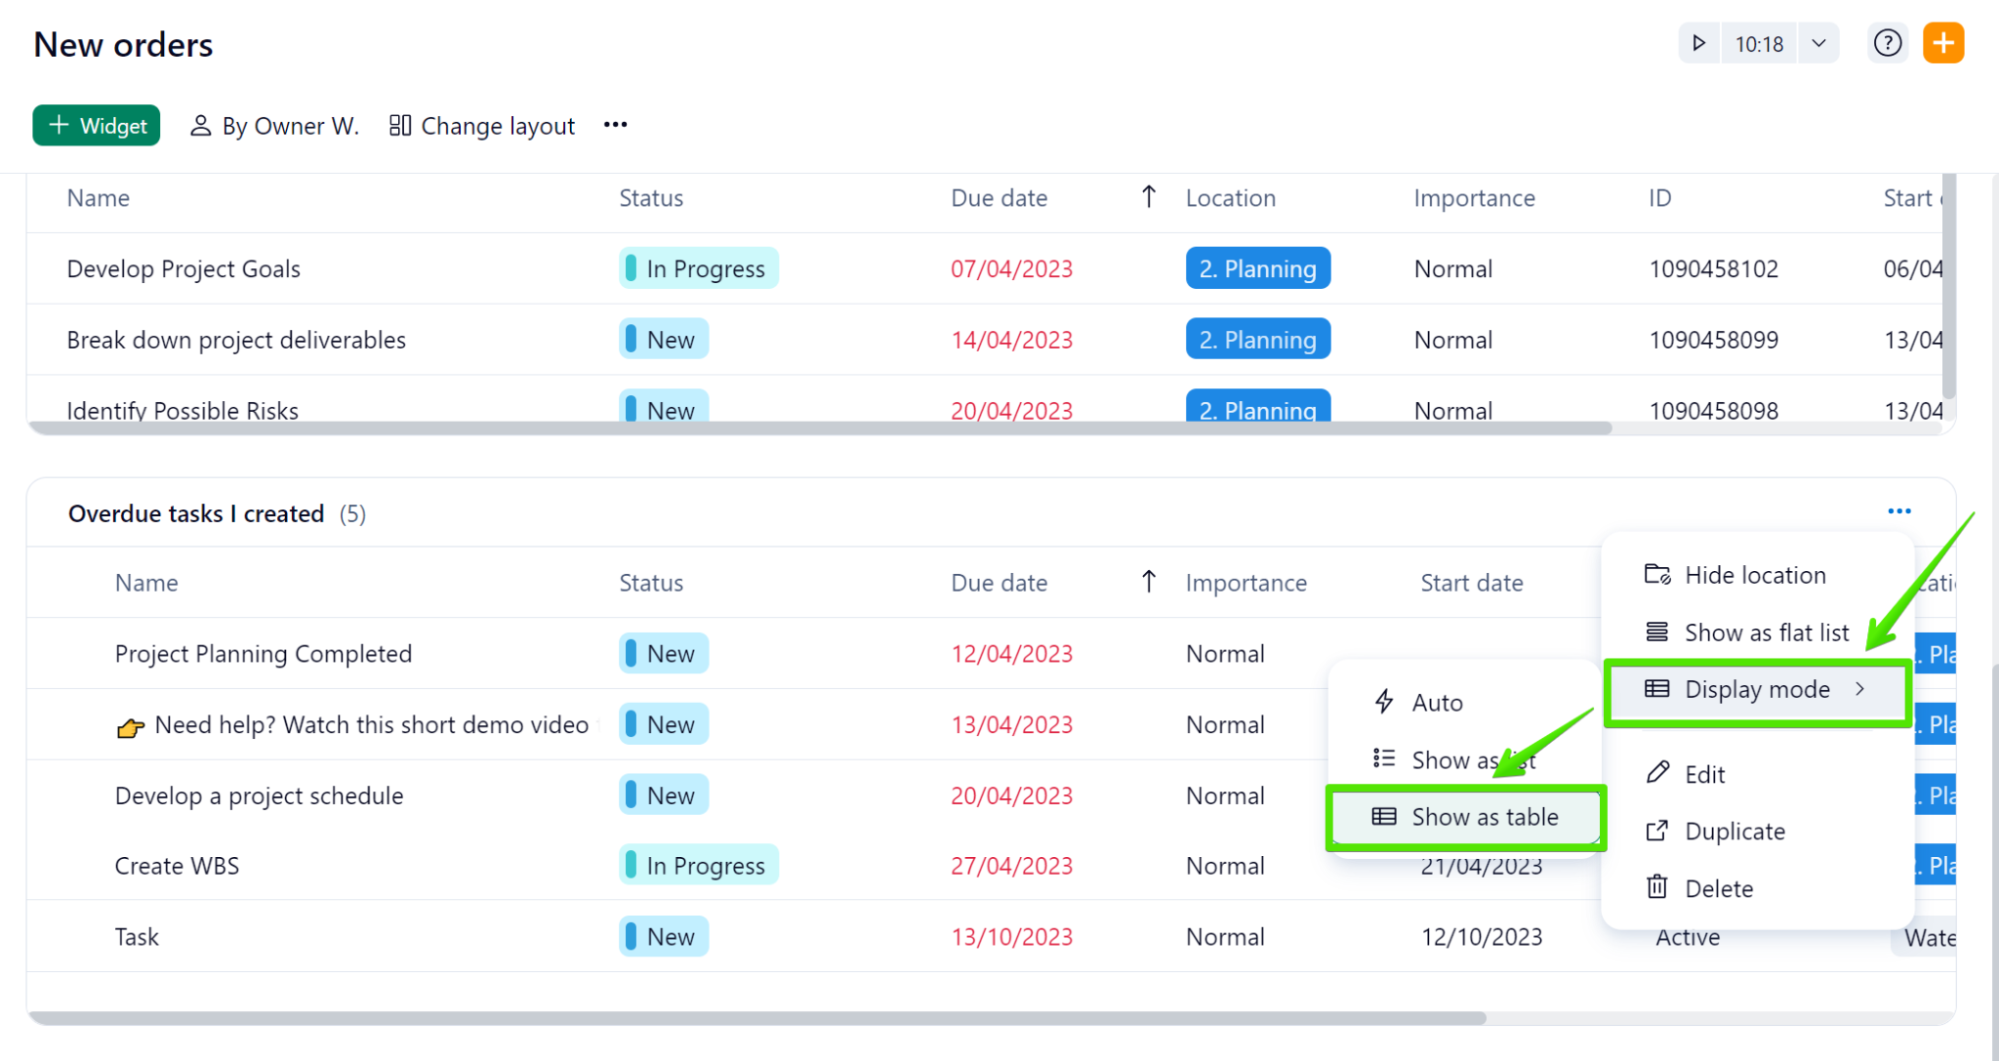
In cases where you need to see data in a compact and vertical mode - which would include only essential information about your items - you can make use of the list mode:
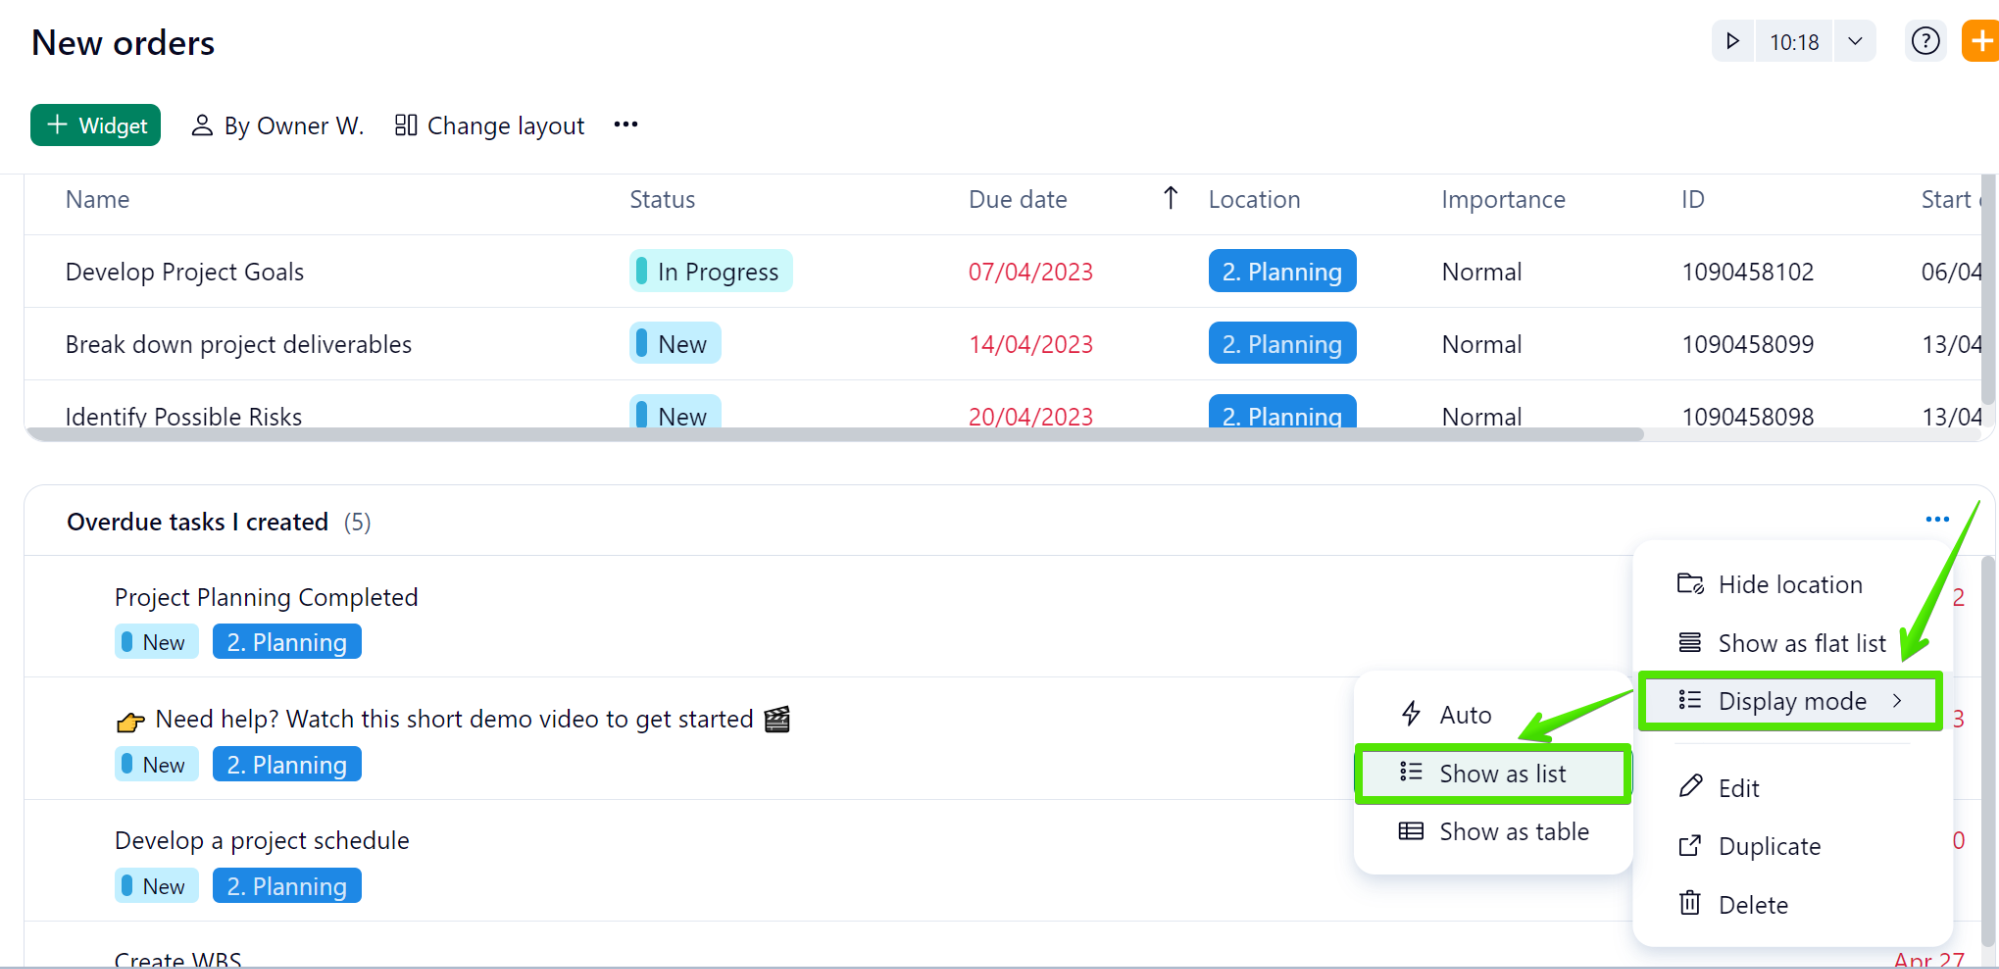
A third option you can benefit from is the ‘Auto mode’, which automatically selects either the Table or List mode depending on the width of your screen: if the available space is enough to include all the information contained in the Table mode, this option will be selected. Otherwise, the List mode will be chosen.
- Add multiple metrics to widgets 🎨
Apart from the option to see your data in different charts, you can now also add multiple metrics to your widgets. You can take advantage of this option when needing to compare data side-by-side in one single Chart-type widget:
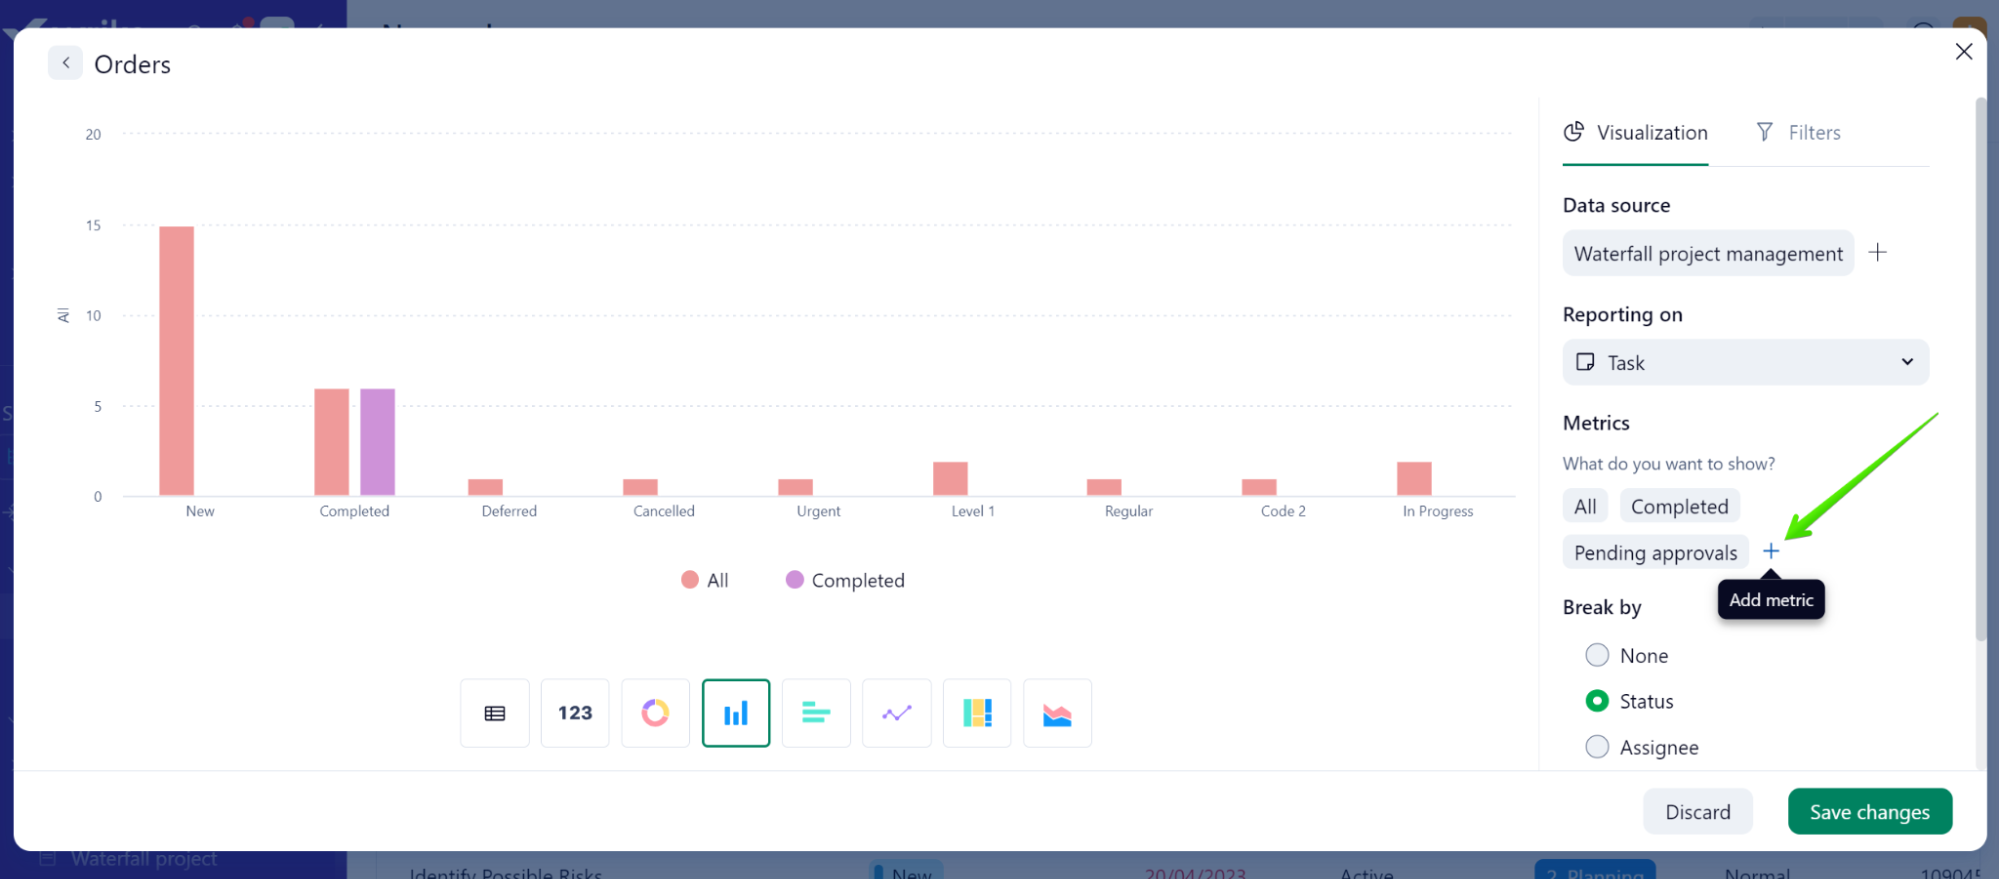
This feature saves you the step of creating two or more widgets to compare, for example, how many tasks are active and how many have been completed in a specific Space, project, or folder.
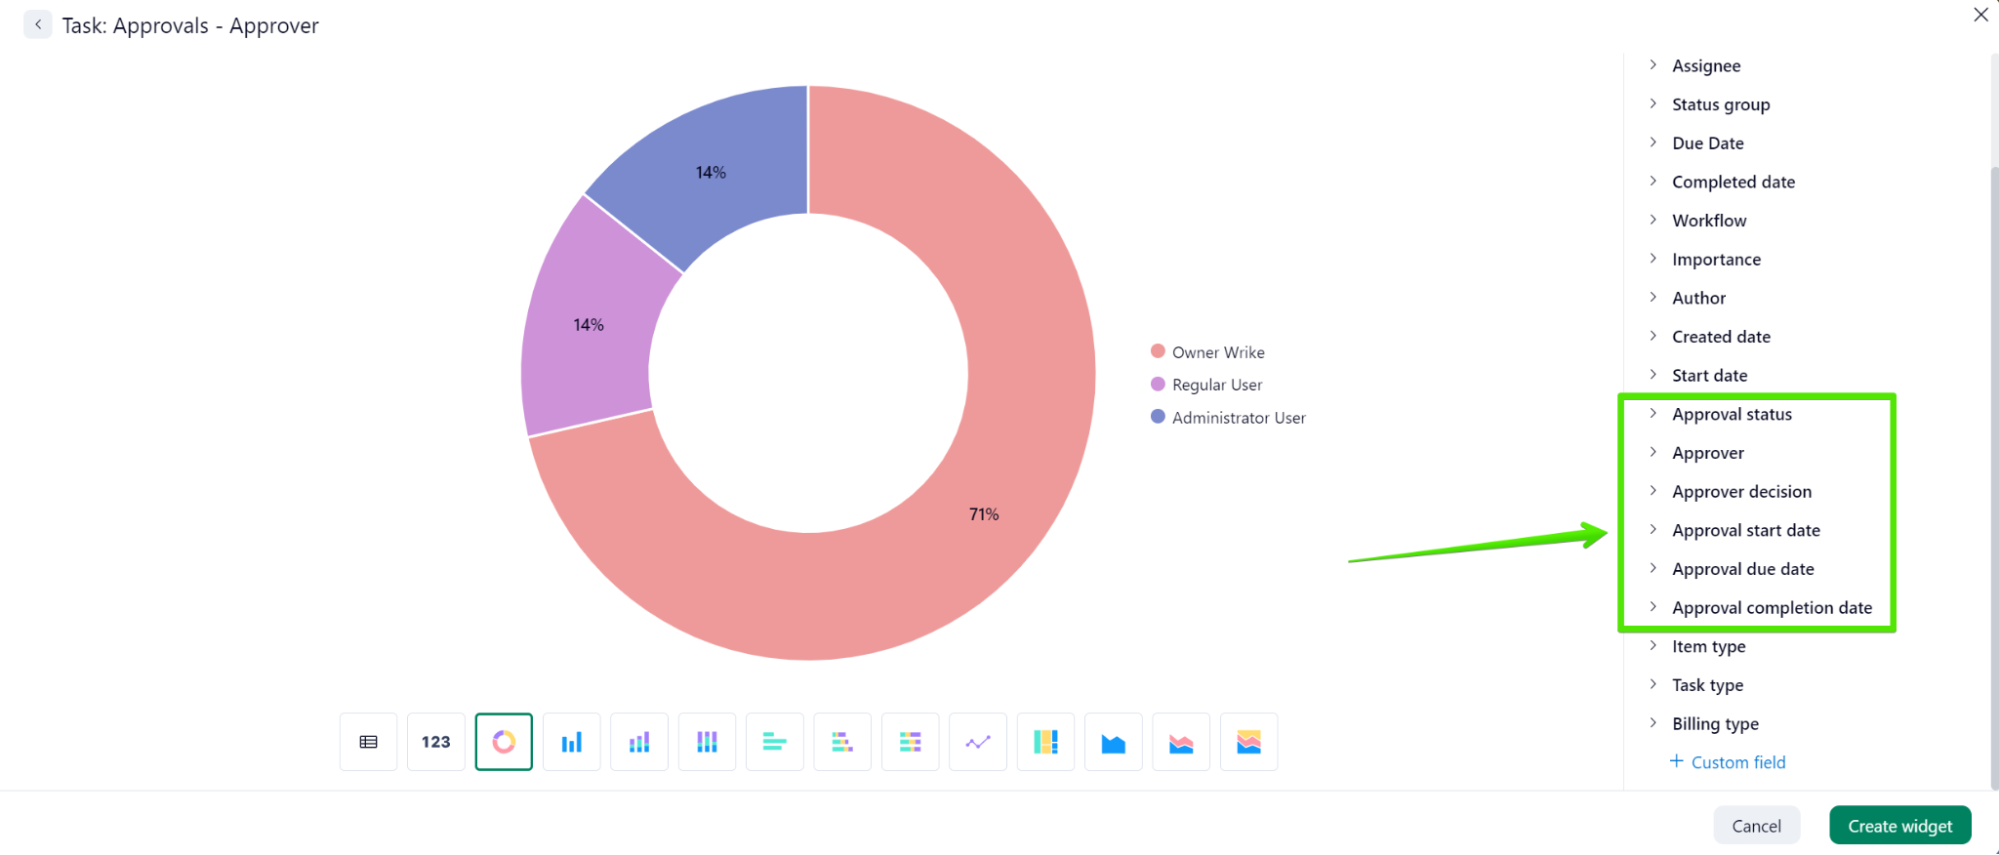
New Dashboards now include a set of Chart-type widgets especially designed for reporting on approvals. In the widget builder, you can access the following options: pending, completed, or overdue approvals; and also total, max, or average approval duration: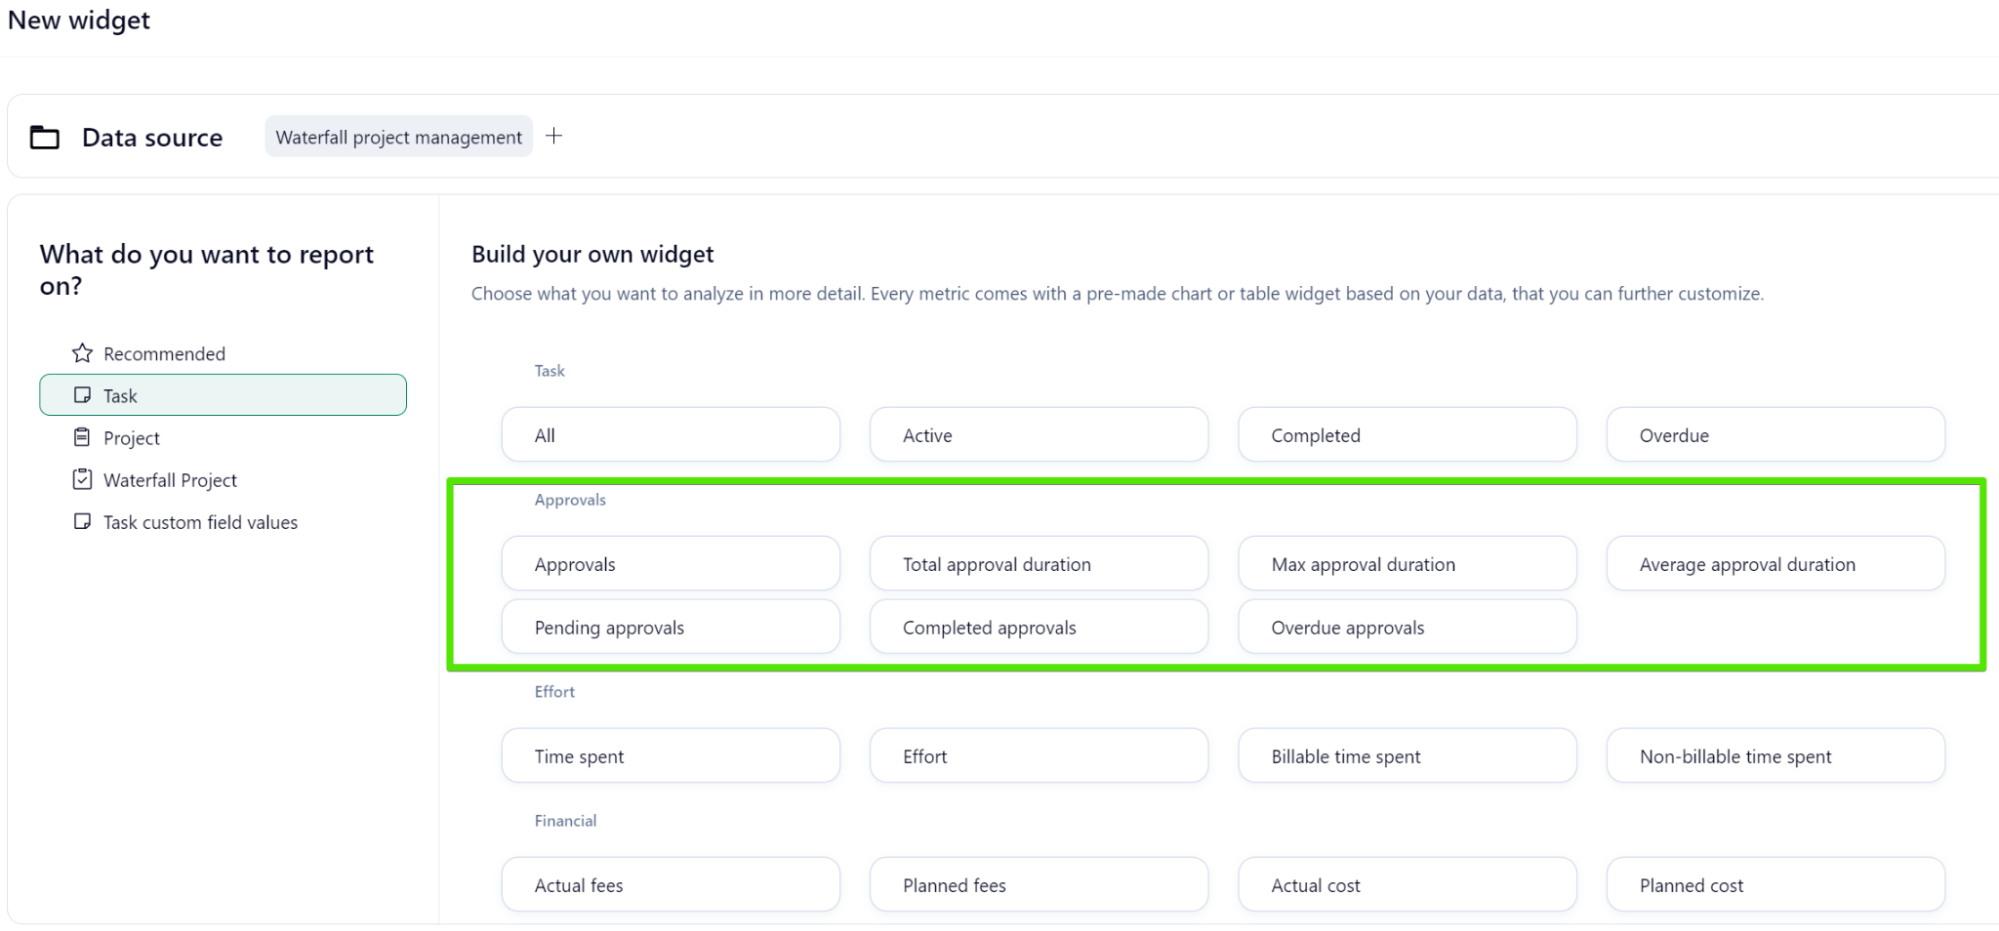
Furthermore, you can choose to break your approvals by: status, approver and approver decision, among other options:
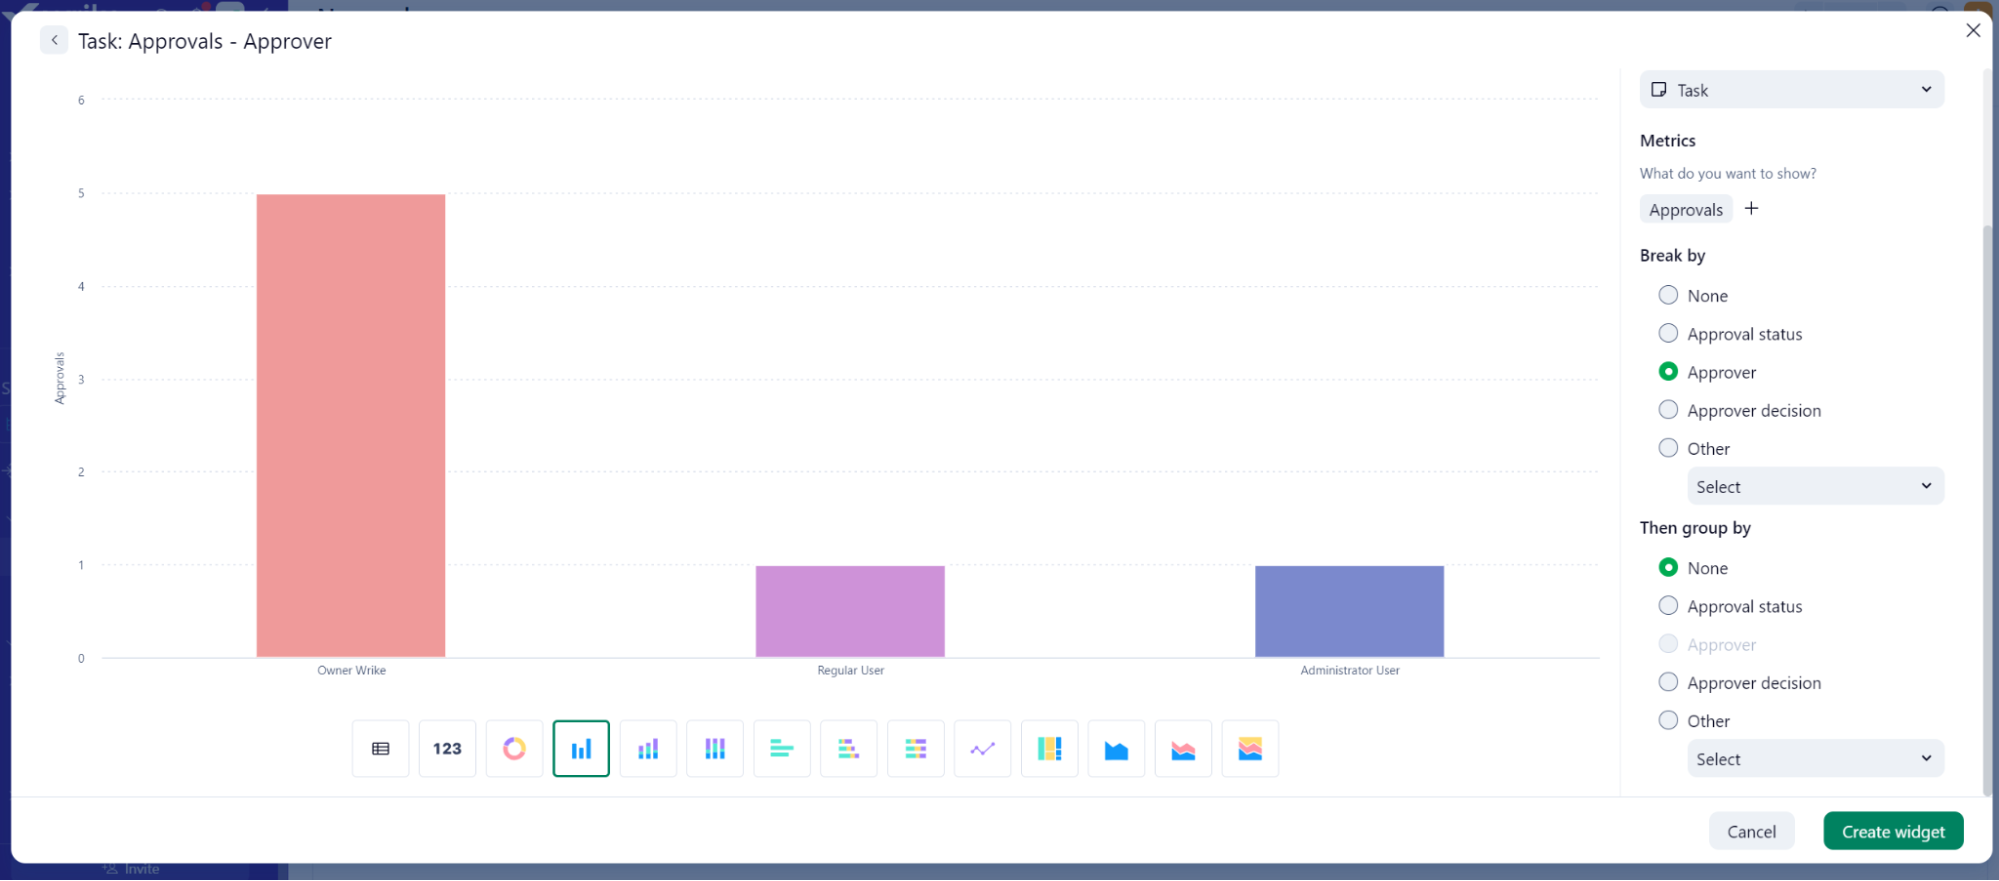
Another crucial addition to New Dashboards is that you can now filter approvals by: status, approver, approver decision (pending, approved, rejected), approval start, due and completion date:
📍 Create, edit, and adjust within one click
- Widgets creation and adjustments 🛠
We've enhanced how you rearrange and create widgets, integrating a "+ Add widget" button available at all division lines on the dashboard. This option allows you to create a widget in a specific location, which saves you the step of rearranging it after its creation.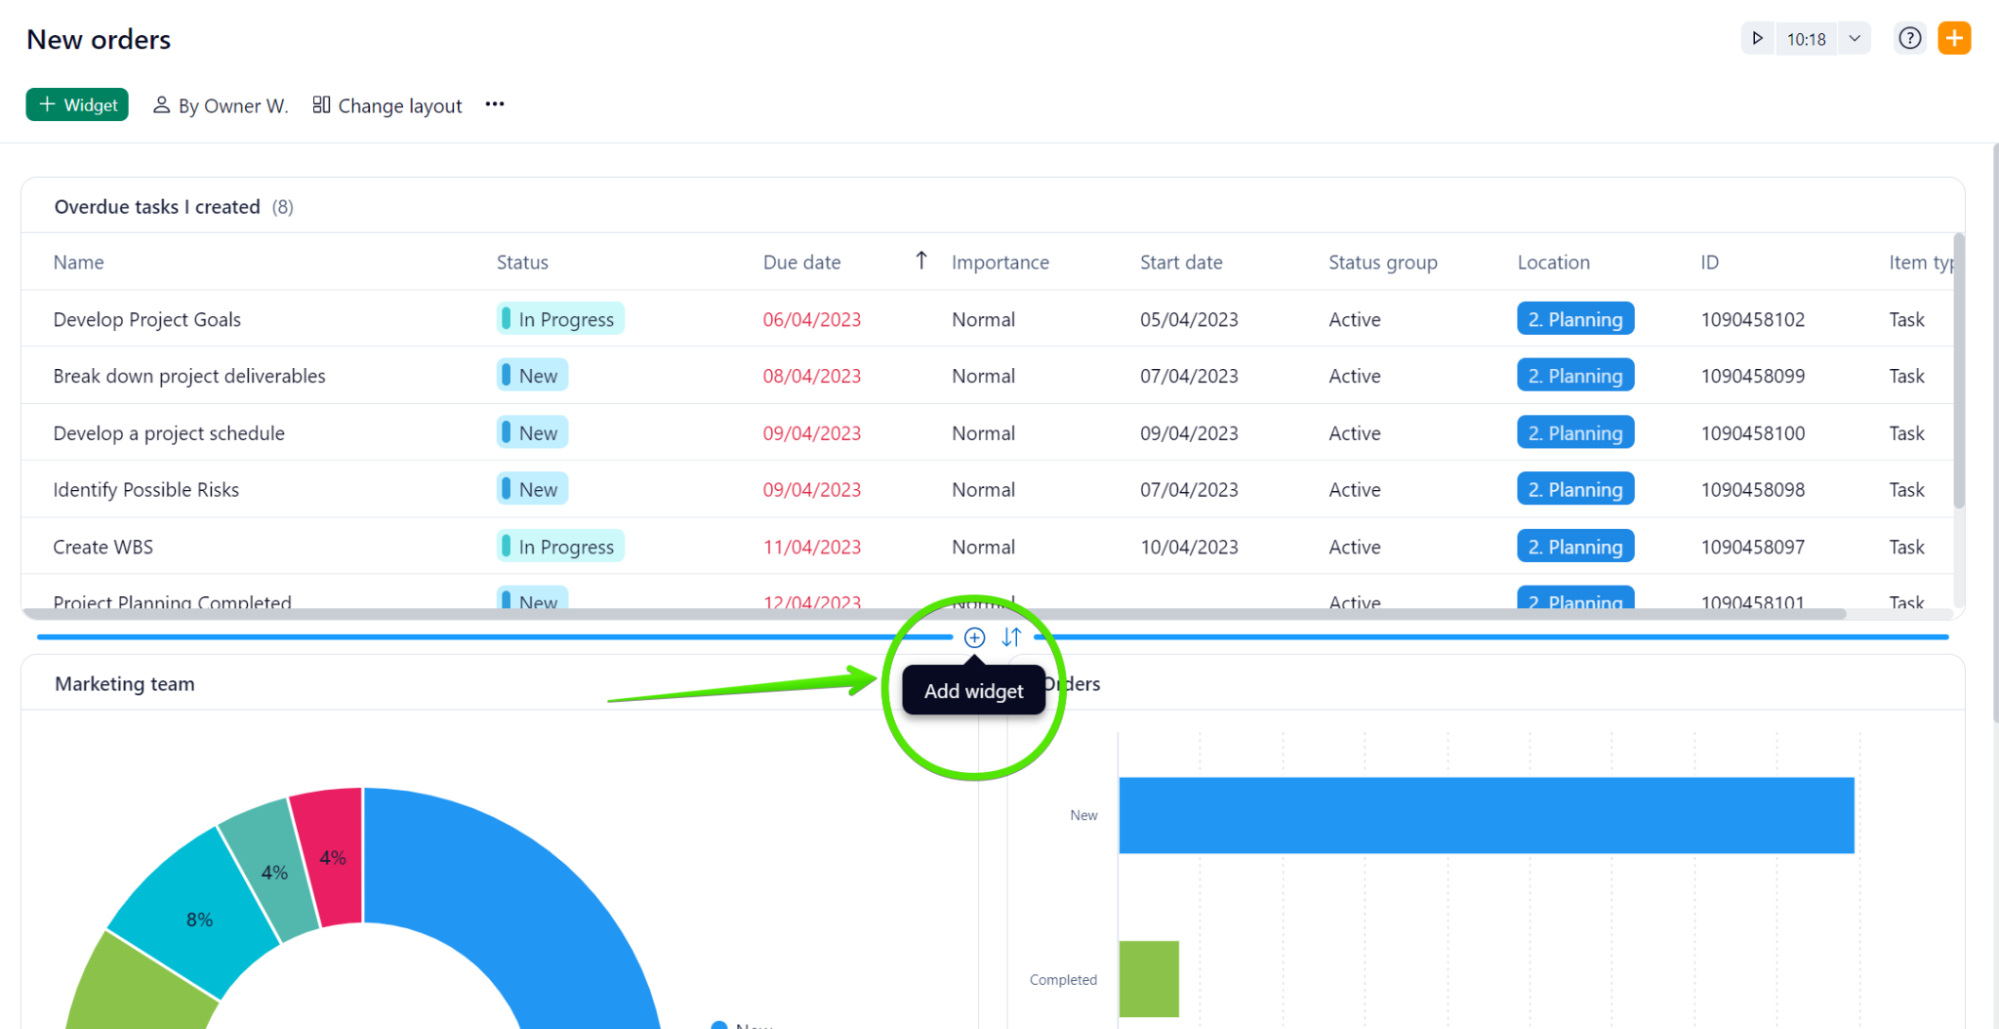
The new "Swap" button now allows exchanging rows, widgets, and even columns, without a glitch. 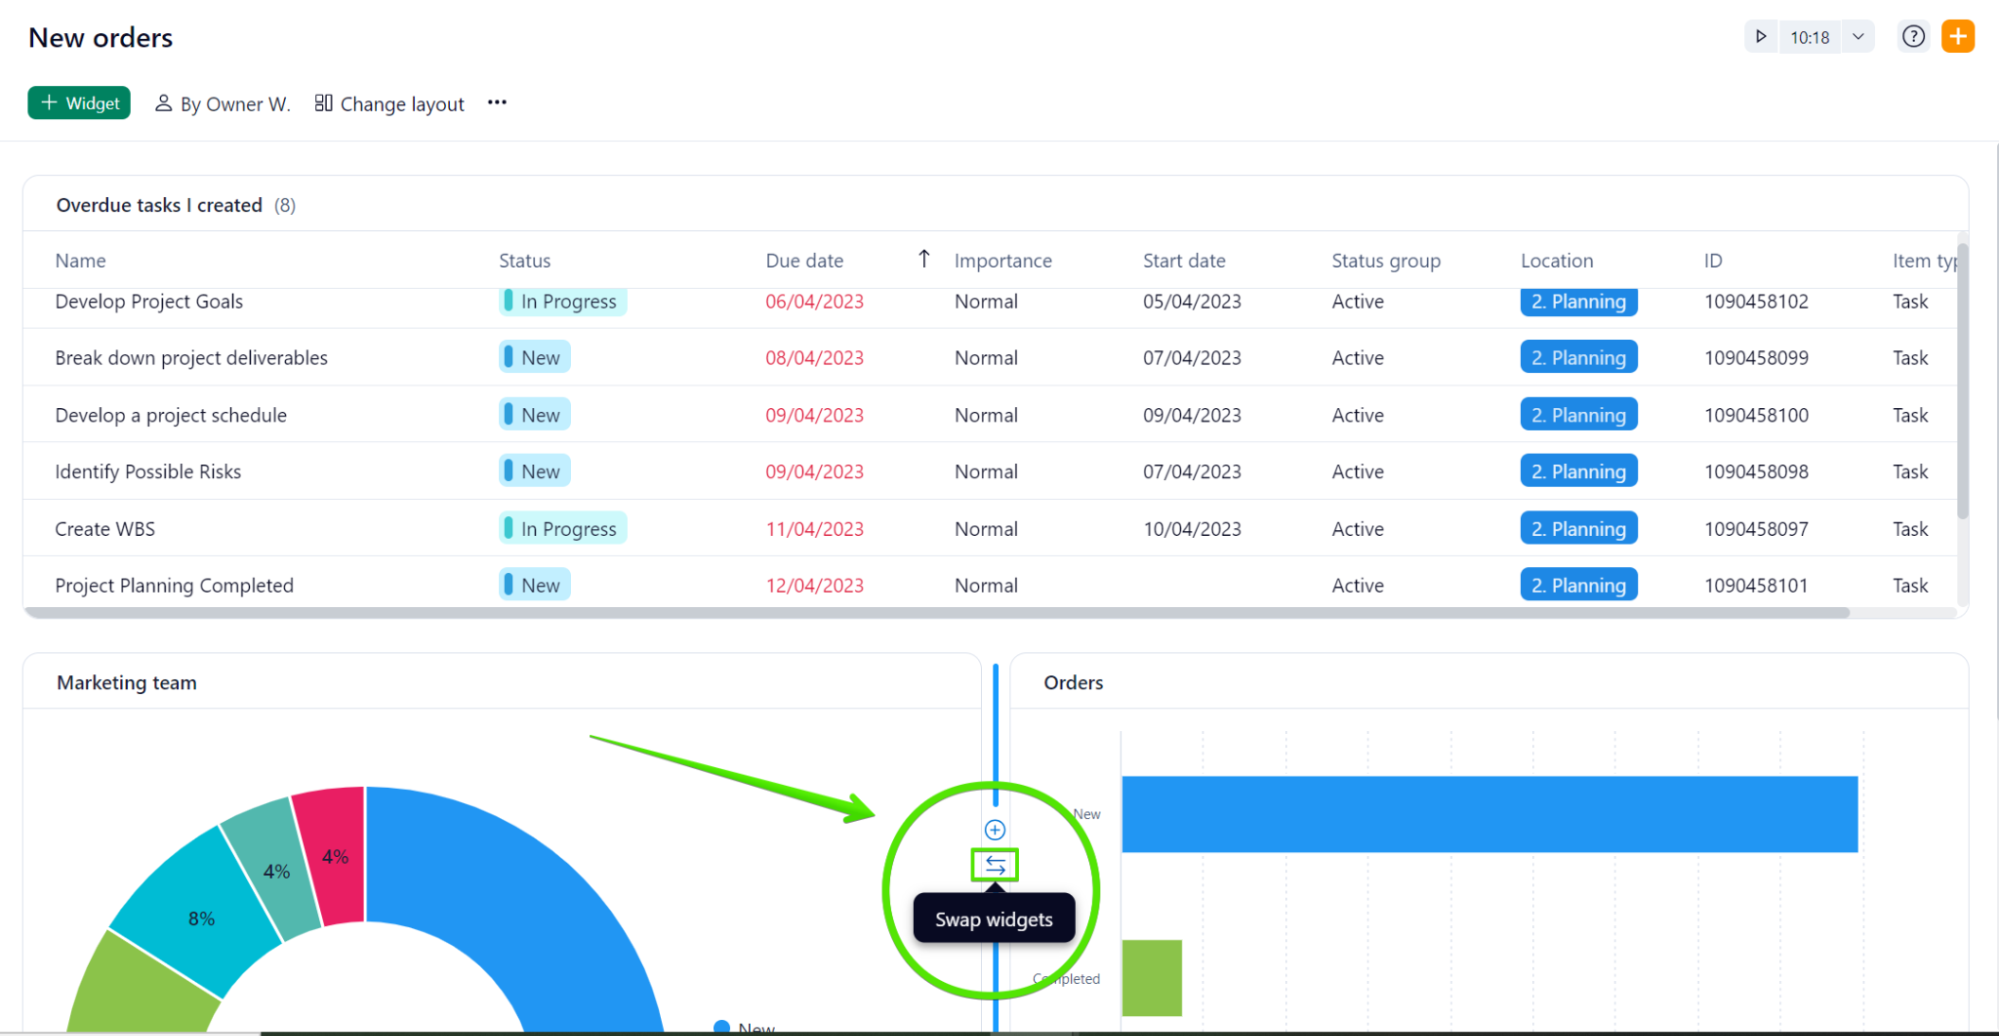
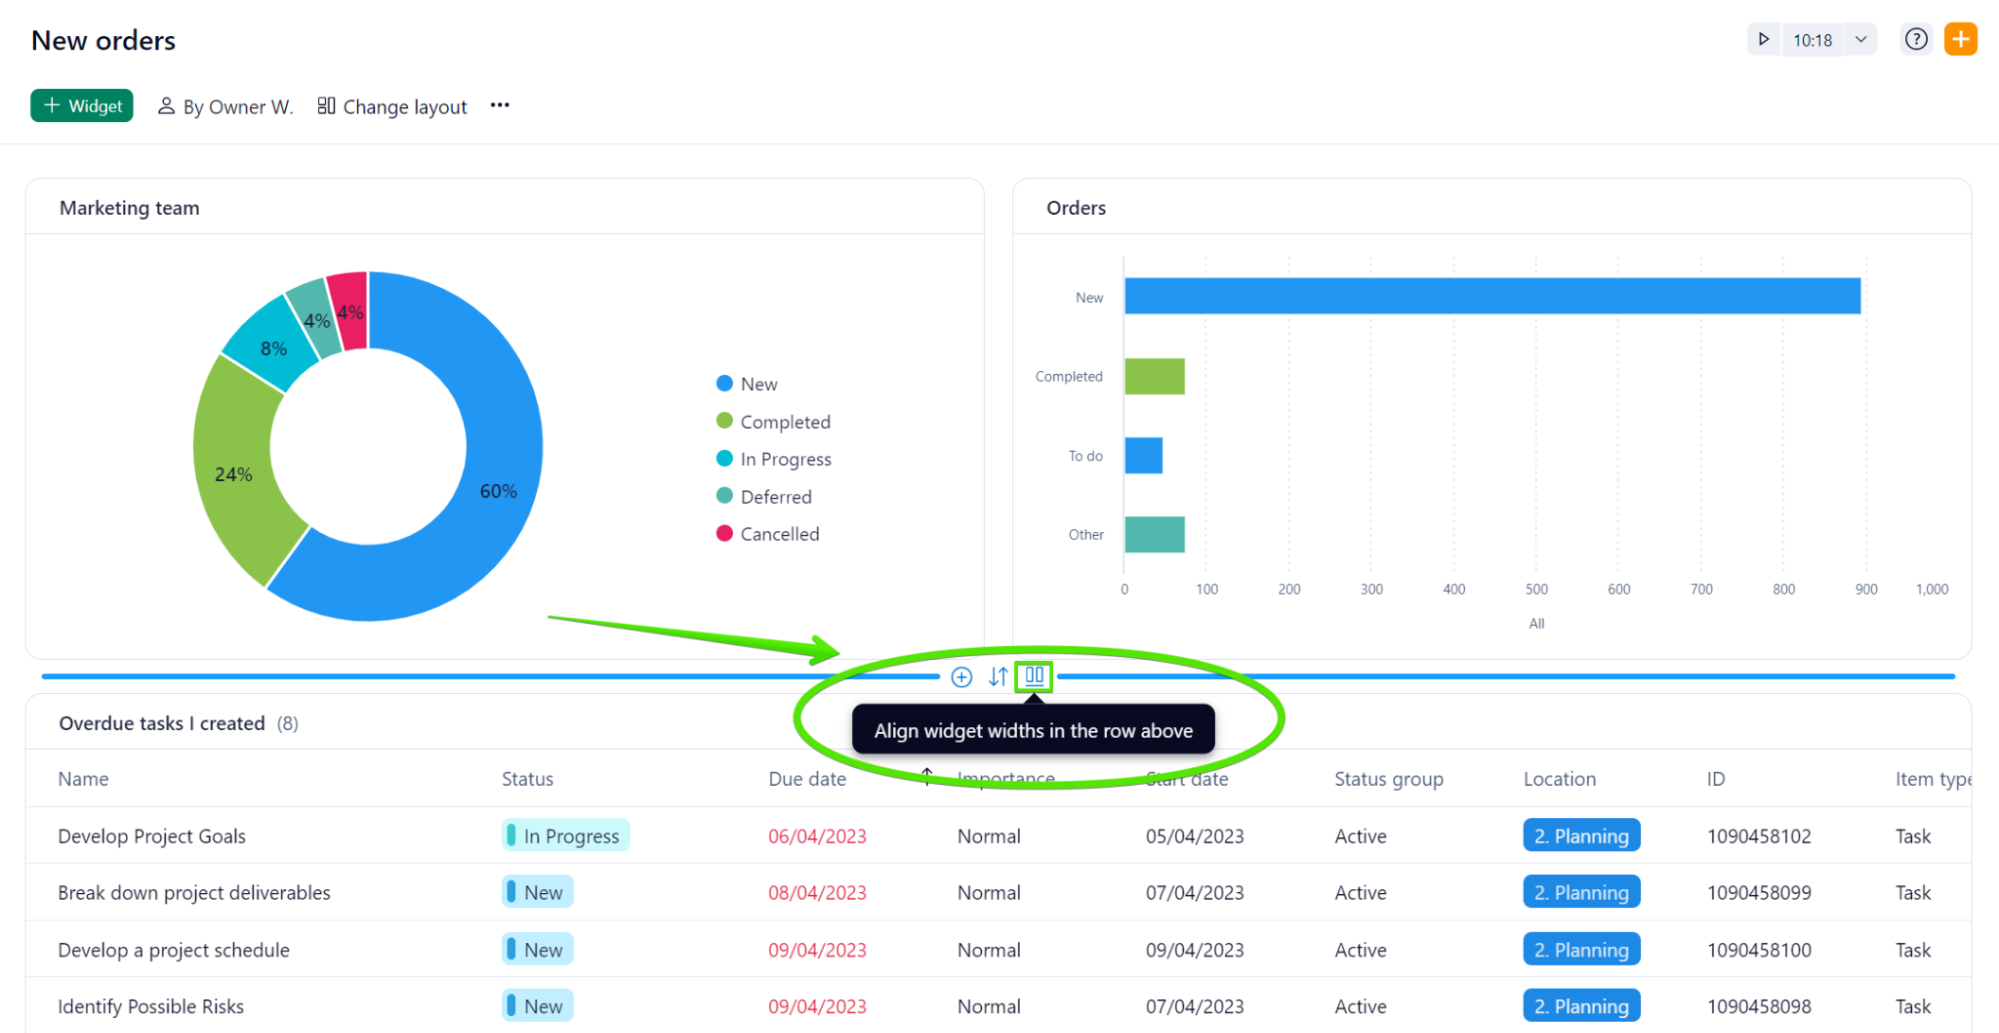
And the "Align" option equalizes the sizes of all widgets in a row/column within a single click, freeing you from individual resizing.
- Duplicate Widget Dashboards 🔄
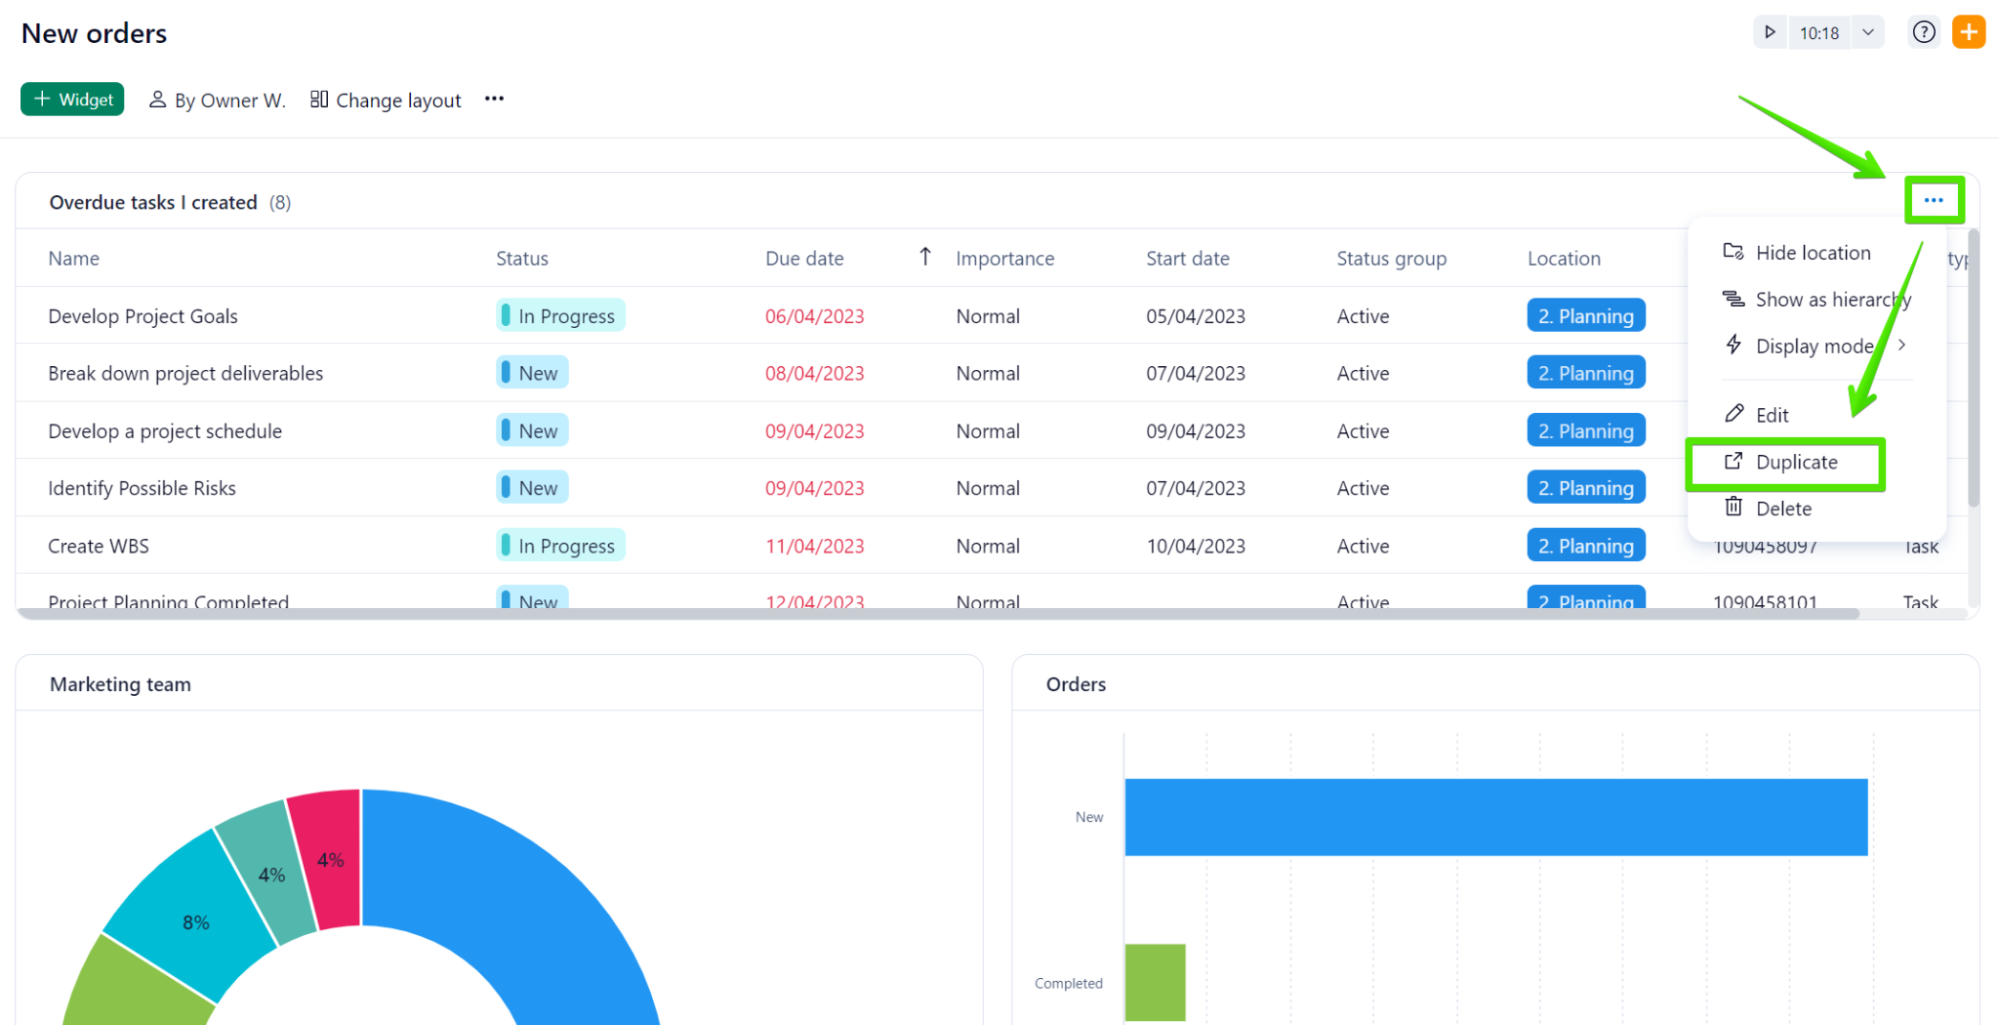
No more wasting time recreating similar widgets! With just a few clicks on the three-dot menu on the right side of the widget's title, you can now comfortably duplicate a dashboard widget, making those small adjustments quicker to cover any specific requirements.
- Drag and Drop Items Between Widgets ⭐
Shifting items between widgets is now as simple as a drag and drop. Please, remember that for successful relocation, the task must align with the filters applied to the destination widget.
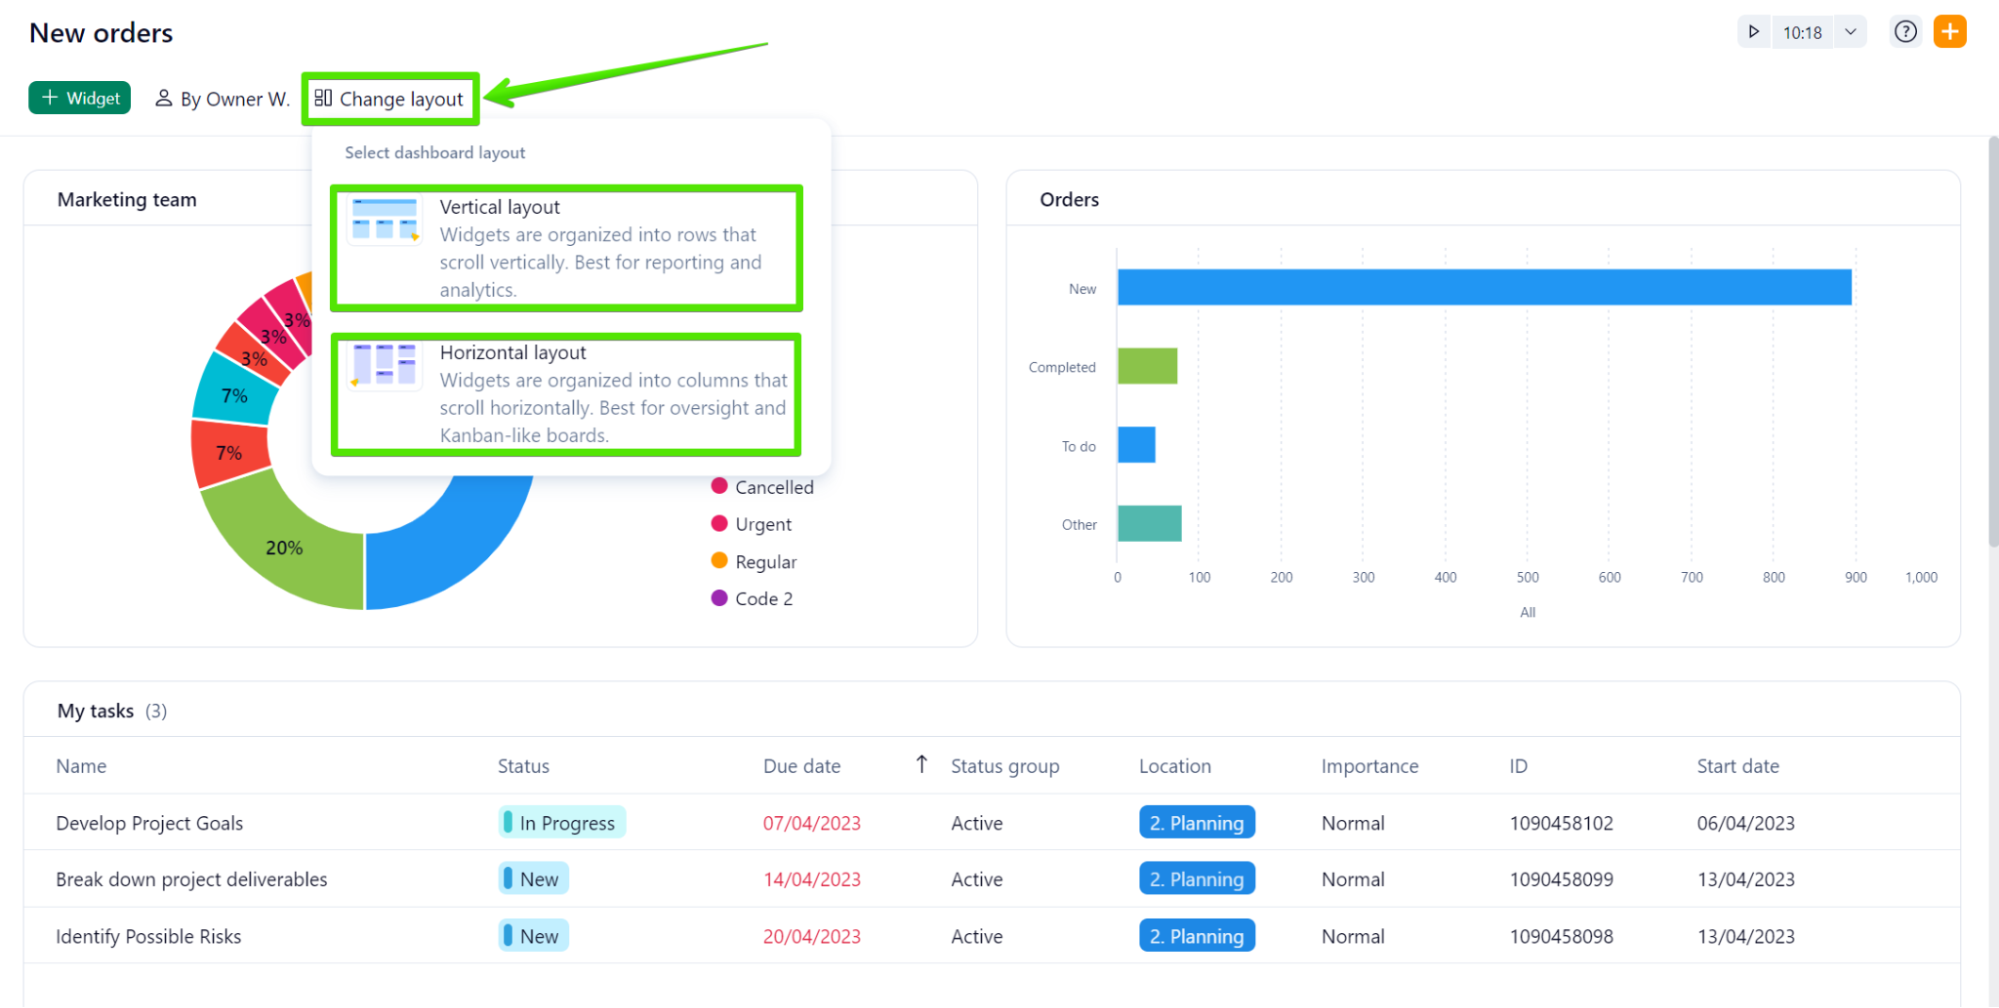
- Vertical and horizontal mode
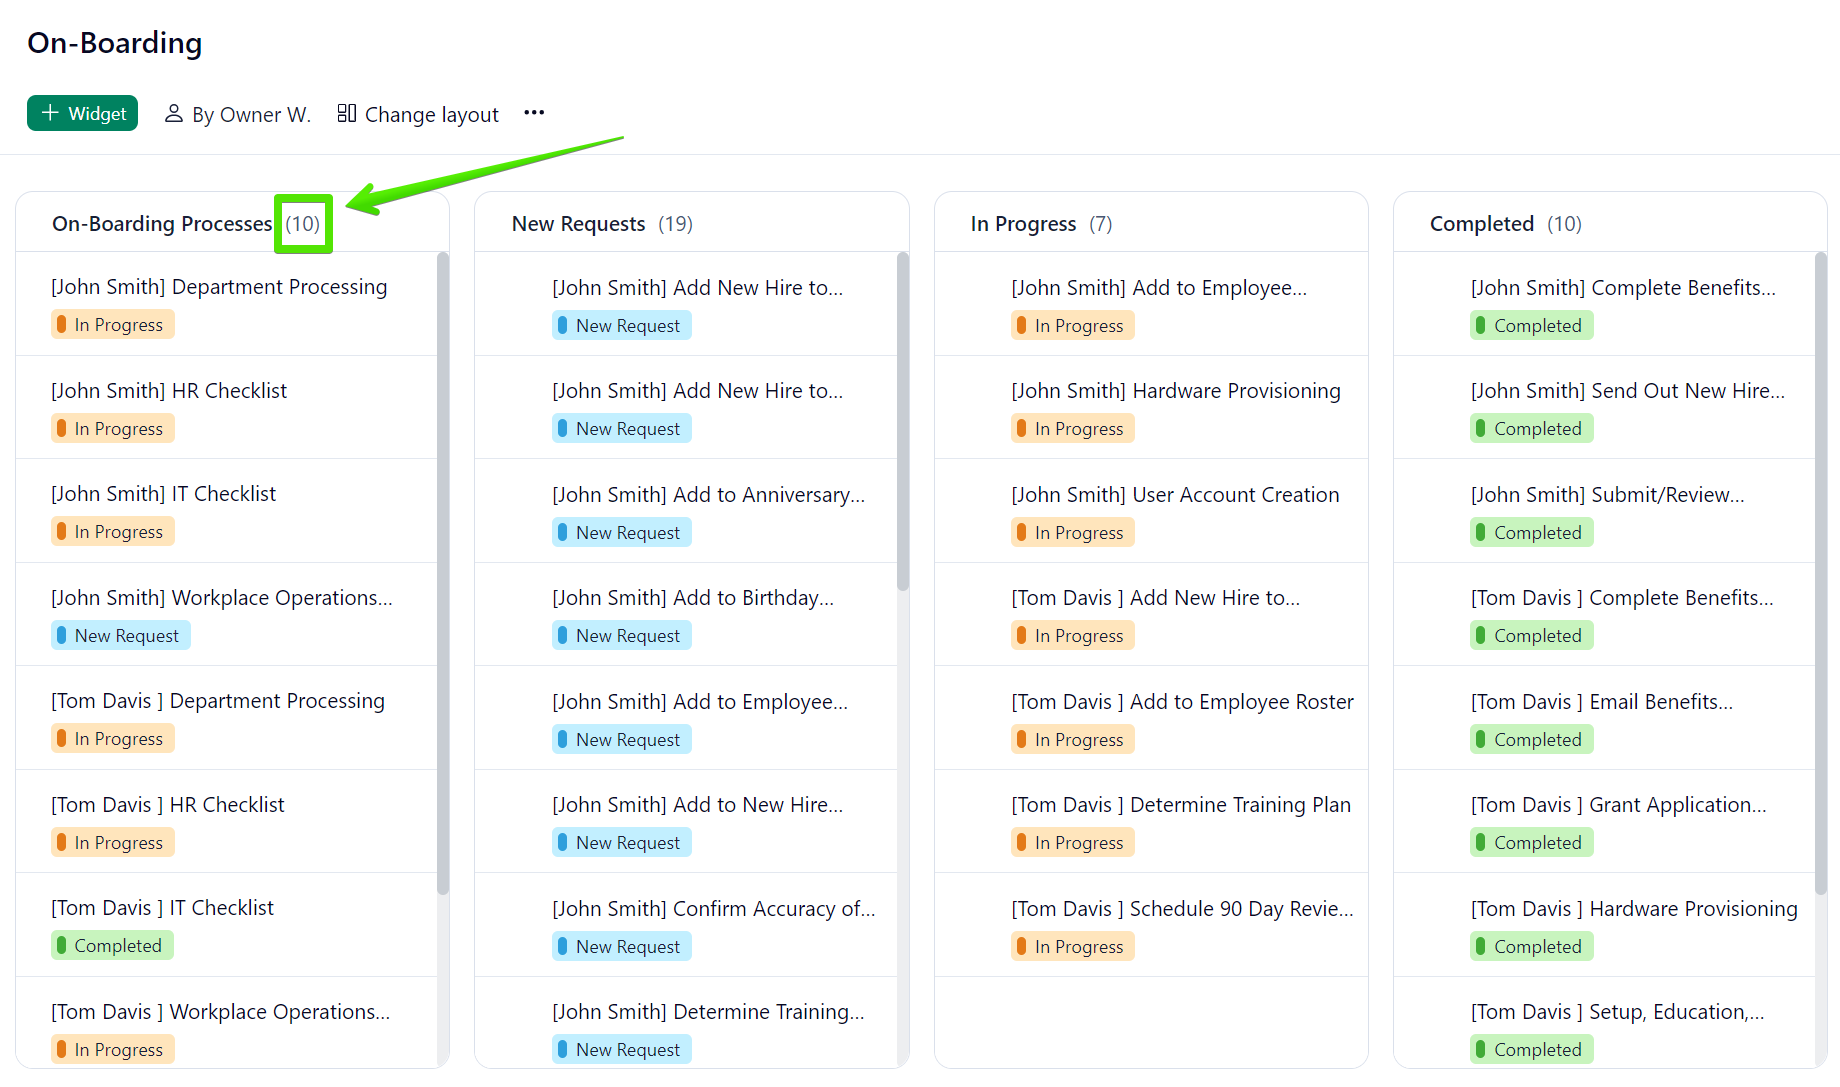
You can now choose to see your widgets displayed in a horizontal or vertical view with the option ‘Change layout’. The vertical option is the best option for reporting and analysis, whereas the horizontal option better suits the need to create a Kanban-style board.
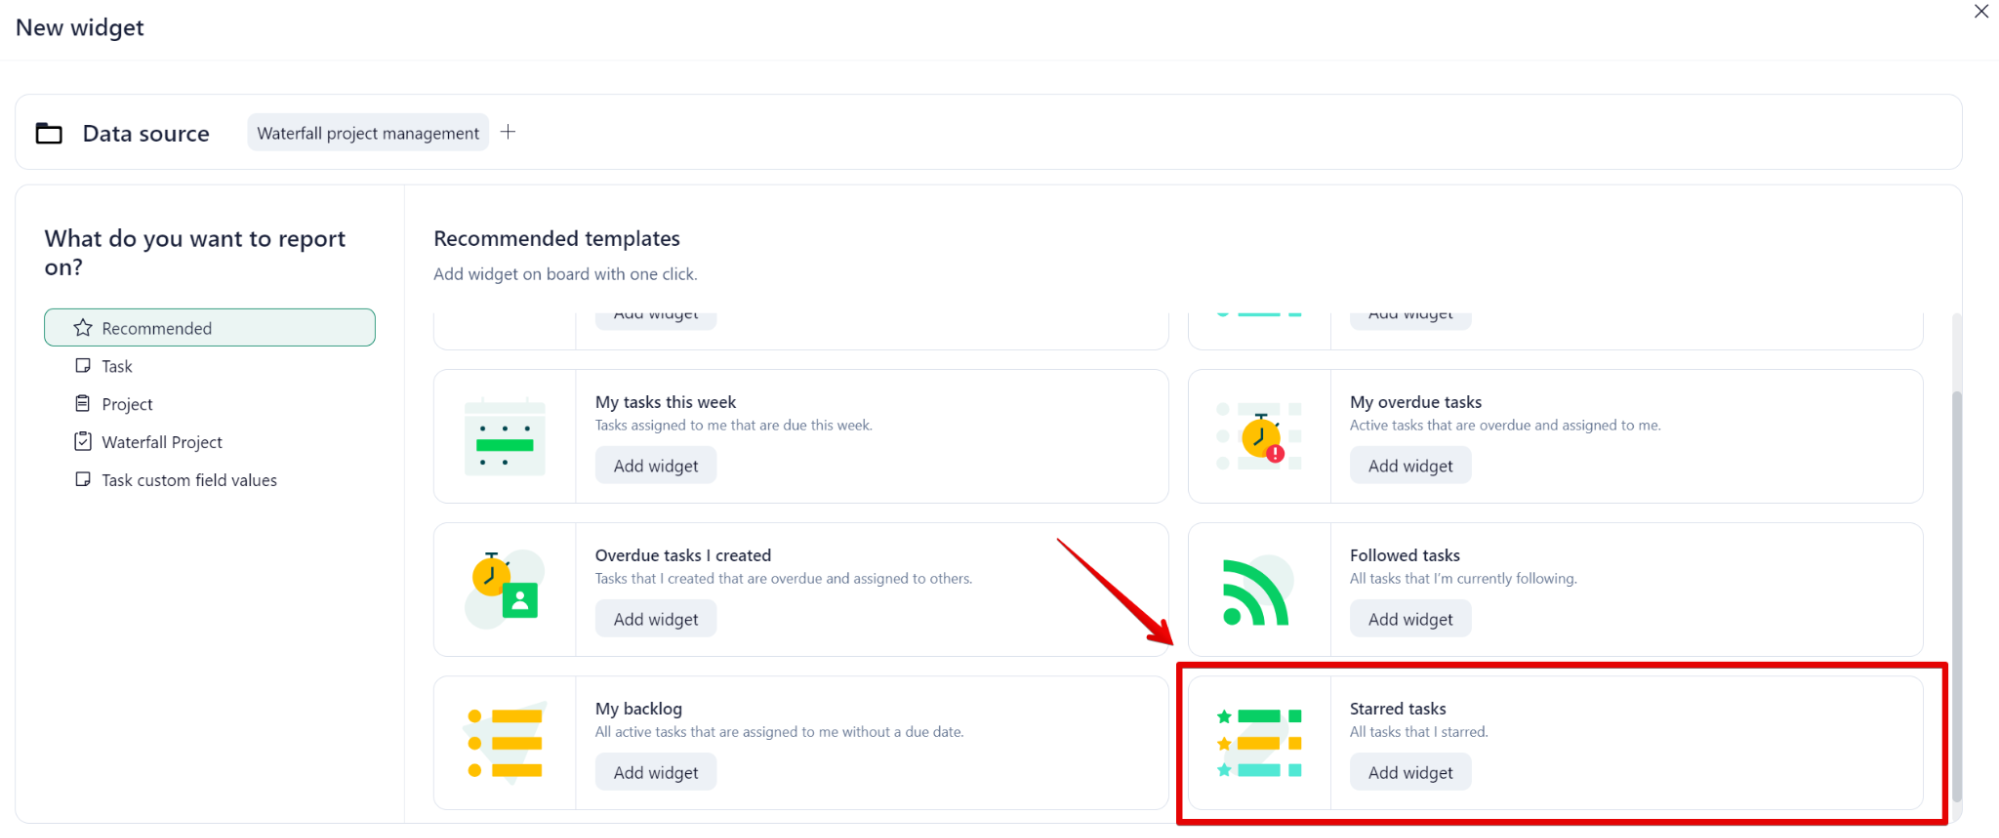
We've added the "Starred Tasks" to the available widgets templates in New Dashboards, making it easier for you to prioritize your important tasks.
New Dashboards are available in the Tool section of the Space they belong to. Also, in the Dashboard account section you can access your classic Dashboards and upgrade them to the new experience. Once a Dashboard has been upgraded, when clicking on it it will be opened in a new window.
Currently, our Product Team is developing a new navigation experience to make it easier for all your Dashboards in one single place. More updates will be announced soon!
With the new item count feature, you'll instantly see how many items are listed in your Dashboard widget without having to manually count. The item count is located next to the title of the widget.
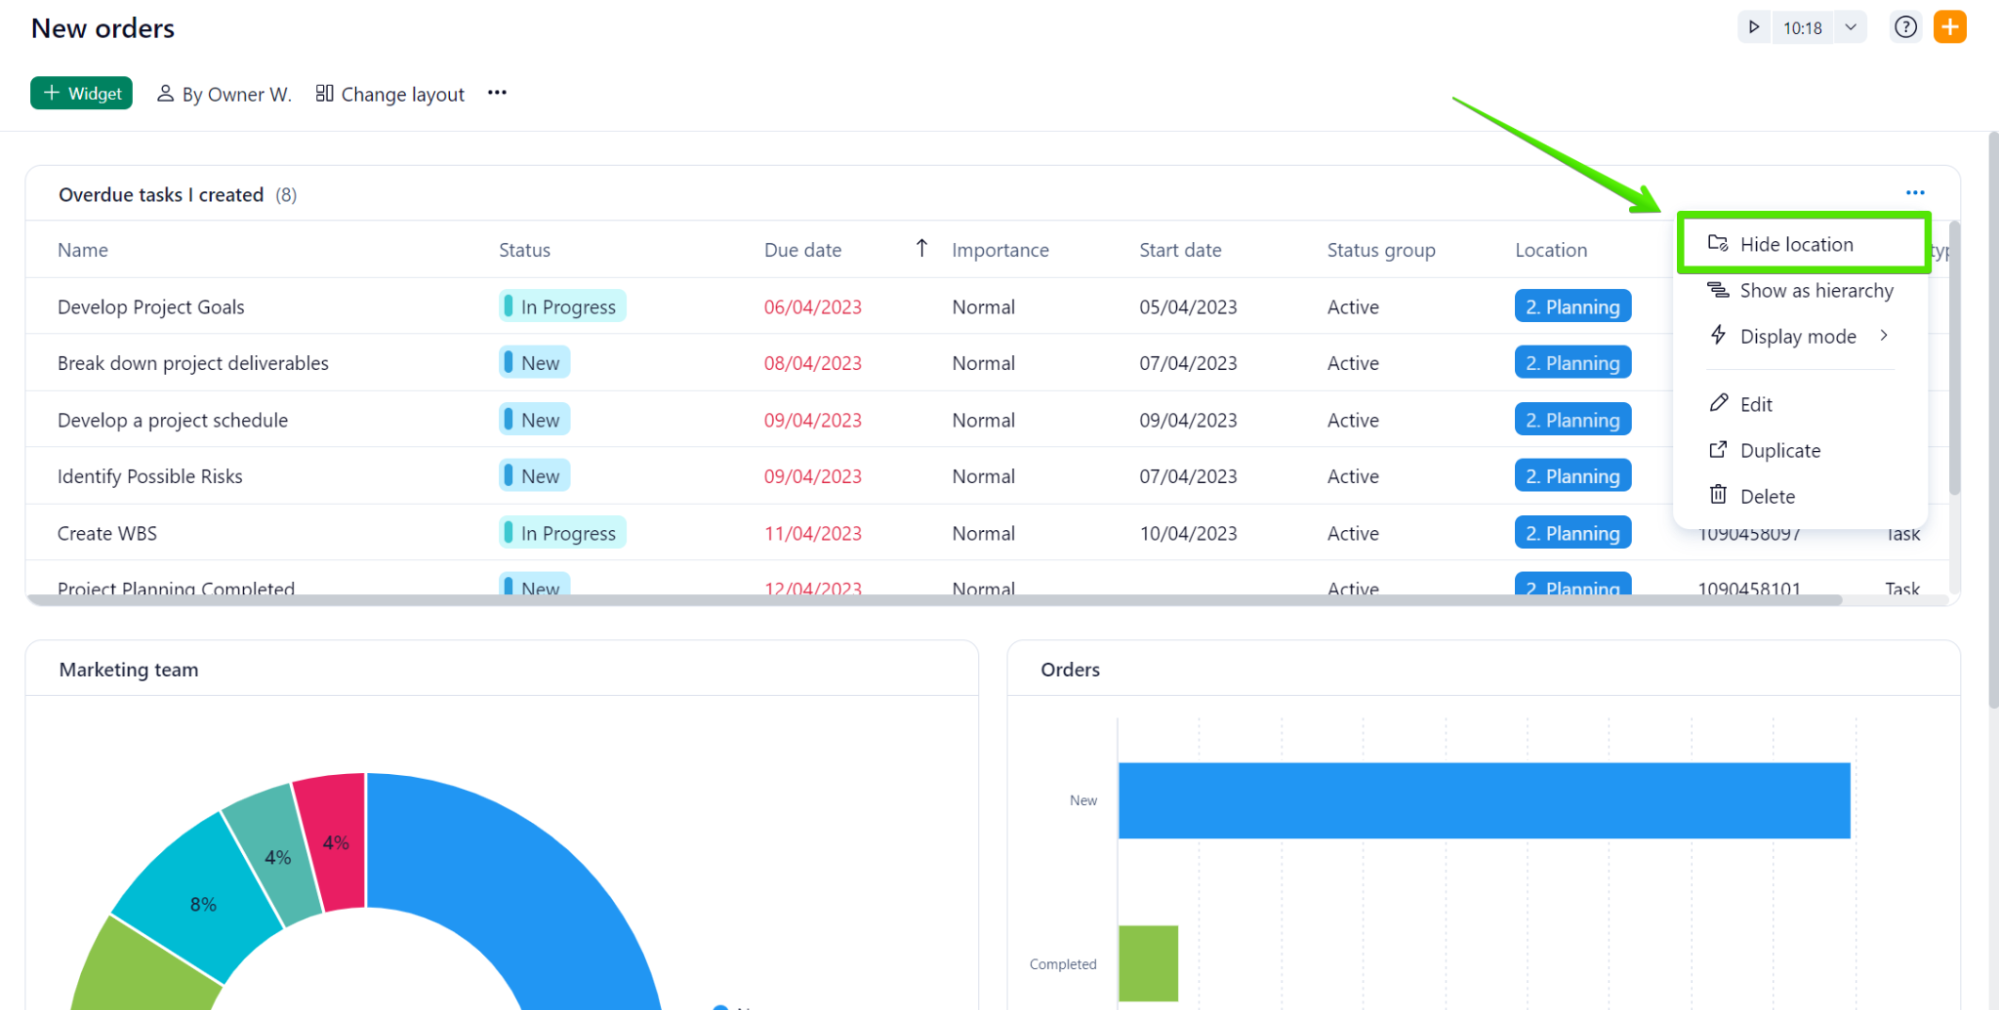
Last but not least, the improved process to toggle location in tables on or off has now become more intuitive and user-friendly.
Are you already enjoying New Dashboards? Let us know in the comments below!
As usual, if you have any questions, we’re here to help 😁