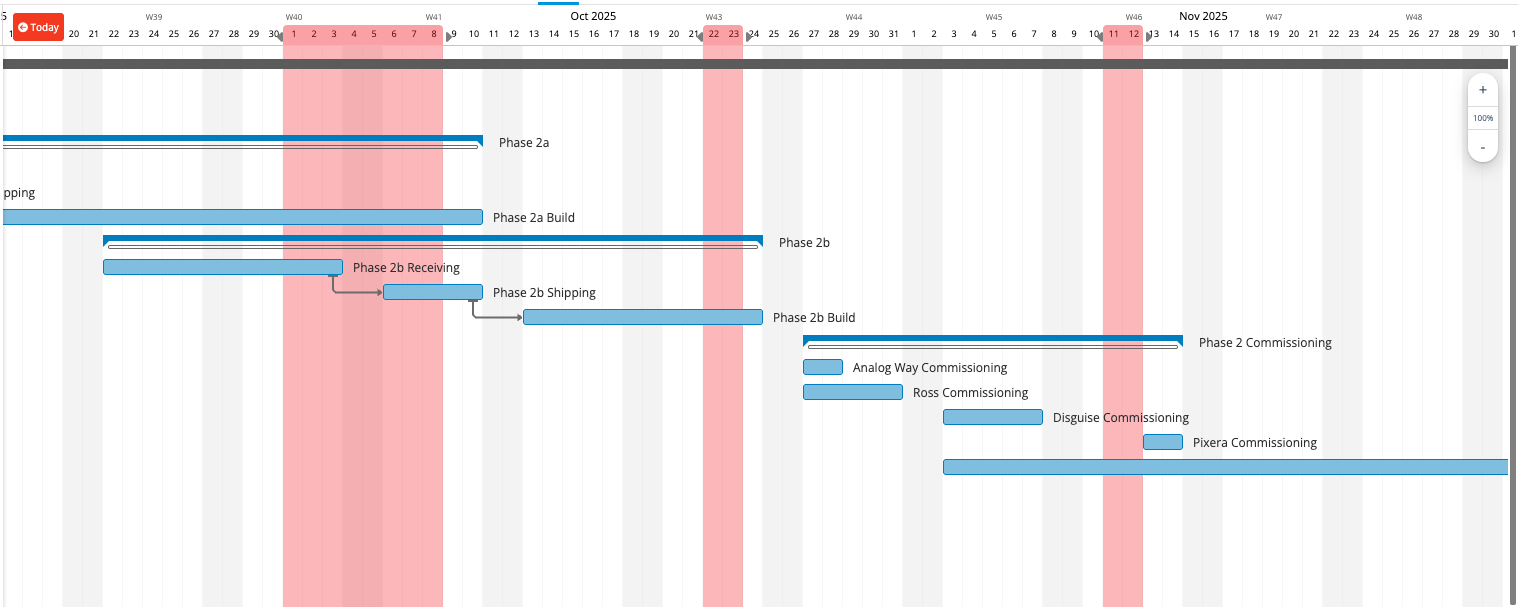
It would be great if the Gantt chart could show date ranges that are considered black-out, or even project phases, or similar, coloring the entire column of dates so that it is clear to see these date ranges no matter how far vertically you scroll. This is done in some competitors' platforms and we find it very useful. Wrike doesn't seem to have a similar feature, but it would be a great add. I have attached a screenshot of an example of this feature from another platform.
At minimum I'd like to see blackout date ranges. But, I could also see defining different date ranges with different colors to signify phases, coordinated date ranges with other 3rd parties, internal company date conflicts (such as a company retreat or something where the entire company is busy), or any other purpose to shade certain date ranges for visual indications.
Be sure to upvote this if you find this helpful and let's try to get it on the developers roadmap.